Free Access
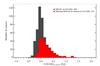
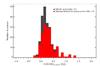
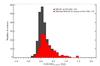
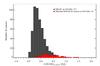
Fig.13

Histogram distribution of ERCSC flux densities at each band in gray. ERCSC sources that are matched with WMAP 5σ sources in a similar band are shown as the red histogram. The WMAP 7 year point source catalogue mask (see text) has been applied to the ERCSC to ensure the same sky coverage.
This figure is made of several images, please see below:
Current usage metrics show cumulative count of Article Views (full-text article views including HTML views, PDF and ePub downloads, according to the available data) and Abstracts Views on Vision4Press platform.
Data correspond to usage on the plateform after 2015. The current usage metrics is available 48-96 hours after online publication and is updated daily on week days.
Initial download of the metrics may take a while.