Fig.18

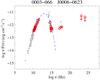
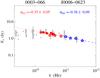
Left-panel: the SED of the source 0003−066. Grey circles show the historical data. The red circles show data simultaneous to the Planck observations. The dotted and dashed lines show the second and third degree polynomials, respectively, fitted to the synchrotron and IC bumps in the SED. Right-panel: the radio spectrum of 0003−066. Red circles, LF data simultaneous to Planck; red stars, ERCSC LFI data; blue circles, HF data simultaneous to Planck; blue stars, ERCSC HFI data. The dashed and dotted lines are fits to simultaneous LF and HF data.
Current usage metrics show cumulative count of Article Views (full-text article views including HTML views, PDF and ePub downloads, according to the available data) and Abstracts Views on Vision4Press platform.
Data correspond to usage on the plateform after 2015. The current usage metrics is available 48-96 hours after online publication and is updated daily on week days.
Initial download of the metrics may take a while.