Fig. 6
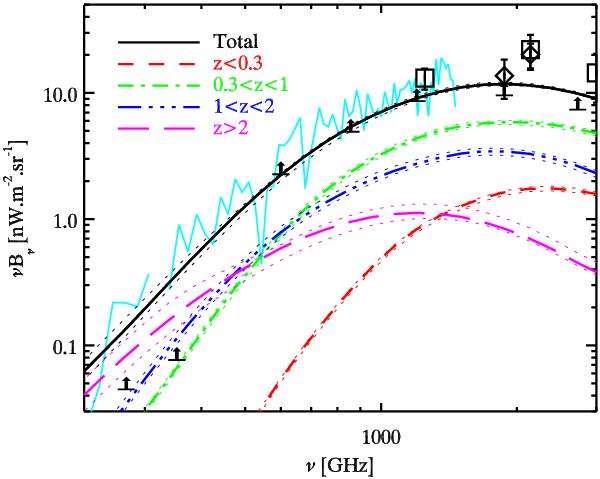
Contribution to the CIB per redshift slice, extracted from Béthermin et al. (2011). The black solid line is the CIB spectrum predicted by the model. The contribution to the CIB from 0 < z < 0.3, 0.3 < z < 1, 1 < z < 2 and z > 2 galaxies is given by the red short-dashed, green dot-dashed, blue three dot-dashed and purple long-dashed lines, respectively. Lower limits coming from the stacking analysis at 100 μm, 160 μm (Berta et al. 2010), 250 μm, 350 μm, 500 μm (Marsden et al. 2009), 850 μm (Greve et al. 2010) and 1.1 mm (Scott et al. 2010) are shown as black arrows. The black diamonds give the Matsuura et al. (2011) absolute measurements with AKARI. The black square the Lagache et al. (2000) absolute measurements with DIRBE/WHAM and the cyan line the Lagache et al. (2000) FIRAS measurement.
Current usage metrics show cumulative count of Article Views (full-text article views including HTML views, PDF and ePub downloads, according to the available data) and Abstracts Views on Vision4Press platform.
Data correspond to usage on the plateform after 2015. The current usage metrics is available 48-96 hours after online publication and is updated daily on week days.
Initial download of the metrics may take a while.