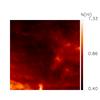
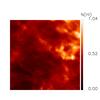
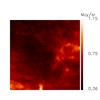
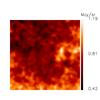
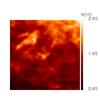
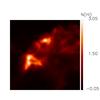
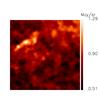
Fig. 5
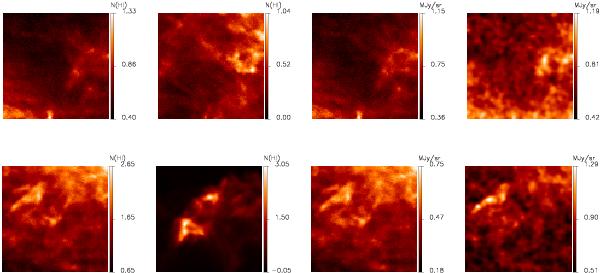
Hi and dust maps for two fields: SP (top)and AG (bottom). The first two maps on the left show the Hi components (Local and IVC for SP, IVC and HVC for AG), the third maps show the 857 GHz emission associated with Hi ( ) and the maps on the right side show the HFI 857 GHz maps. Those HFI maps have been convolved by the GBT beam to allow a better comparison by eye. Hi maps are given in units of 1020 atomscm-2. Note the correlation of the dust emission with the different Hi velocity components and its variation from field to field.

Current usage metrics show cumulative count of Article Views (full-text article views including HTML views, PDF and ePub downloads, according to the available data) and Abstracts Views on Vision4Press platform.
Data correspond to usage on the plateform after 2015. The current usage metrics is available 48-96 hours after online publication and is updated daily on week days.
Initial download of the metrics may take a while.