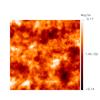
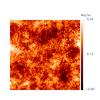
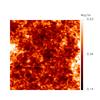
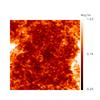
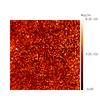
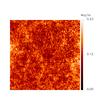
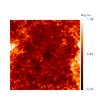
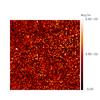
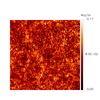
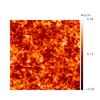
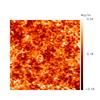
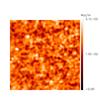
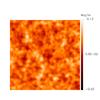
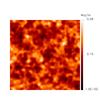
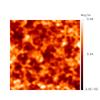
Fig. 4
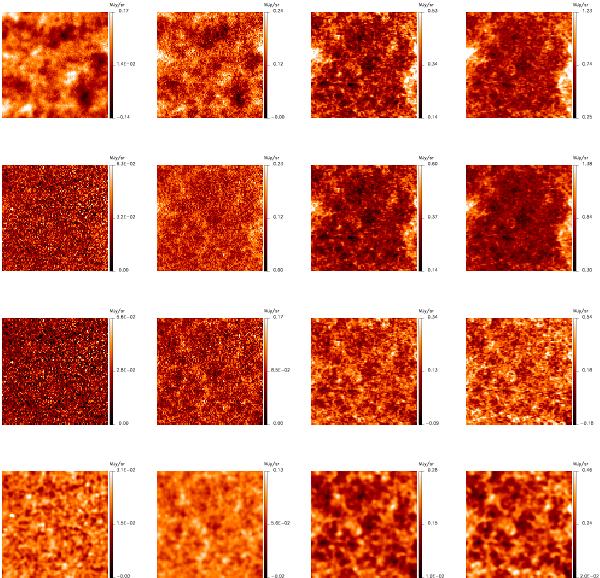
Maps of the 26 deg2 of the N1 field, from left to right: 217, 353, 545 and 857 GHz. From top to bottom: raw HFI maps; CMB- and ERCSC source-cleaned maps; residual maps (CMB-, sources-, and cirrus-cleaned); residual maps smoothed at 10′ to highlight the CIB anisotropies. The joint structures clearly visible (bottom row) correspond to the anisotropies of CIB. Residual point sources are also visible. They have fluxes lower than the fluxes of the ERCSC removed sources. They have no impact on our analysis.

Current usage metrics show cumulative count of Article Views (full-text article views including HTML views, PDF and ePub downloads, according to the available data) and Abstracts Views on Vision4Press platform.
Data correspond to usage on the plateform after 2015. The current usage metrics is available 48-96 hours after online publication and is updated daily on week days.
Initial download of the metrics may take a while.