Fig. 21
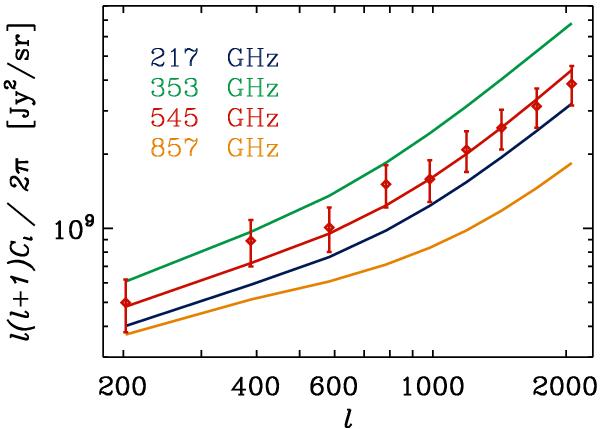
Predicted 545 GHz power spectra derived from each frequency’s best-fit model. For the best-fit model at 217, 353, 545 and 857 GHz, we plot the predicted clustering plus shot-noise power spectra at 545 GHz. Also shown are the HFI data points at 545 GHz (red diamonds). This plot suggests that the fits across frequencies are fairly different, which hints at an evolution in the population of galaxies we probed. We note, however, that the uncertainties associated with each prediction are not fully characterised by our method.
Current usage metrics show cumulative count of Article Views (full-text article views including HTML views, PDF and ePub downloads, according to the available data) and Abstracts Views on Vision4Press platform.
Data correspond to usage on the plateform after 2015. The current usage metrics is available 48-96 hours after online publication and is updated daily on week days.
Initial download of the metrics may take a while.