Fig. 20
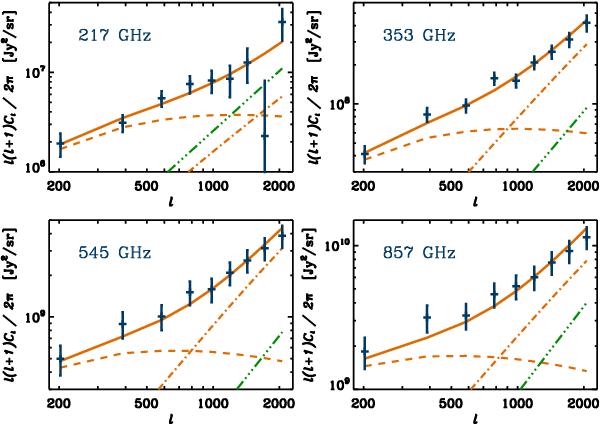
Angular power spectrum of CIB anisotropies at 217, 353, 545, and 857 GHz. Each panel corresponds to one frequency. For each frequency, the blue points correspond to the angular auto power-spectra, and the associated error bars include statistical and photometric calibration systematic contributions. The best-fit model per frequency (including shot noise) corresponds to the solid orange line. The dashed (dot-dashed) orange lines correspond to the 2 h (1 h) contributions. The green triple dot-dashed curve corresponds to the Poisson noise level, fixed to its expected value. To obtain these fits, three parameters per frequency were varied: log 10Mmin, αsat and jeff. The fits are obviously qualitatively very good.
Current usage metrics show cumulative count of Article Views (full-text article views including HTML views, PDF and ePub downloads, according to the available data) and Abstracts Views on Vision4Press platform.
Data correspond to usage on the plateform after 2015. The current usage metrics is available 48-96 hours after online publication and is updated daily on week days.
Initial download of the metrics may take a while.