Fig. 18
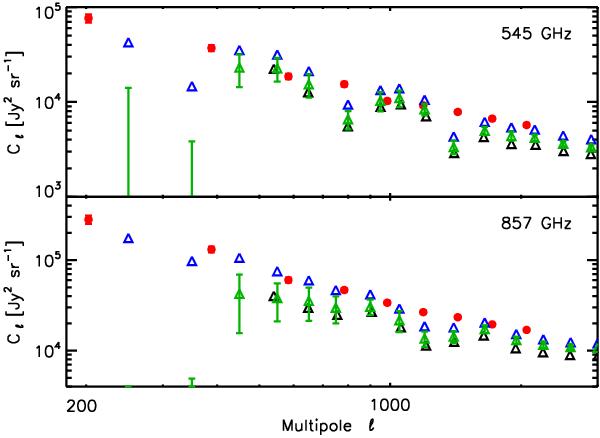
Comparison of SPIRE and HFI measurements at 545 and 857 GHz in the overlapping multipole range. HFI data points are the red circles; SPIRE data points from Amblard et al. (2011) are the black triangles. For these data points sources down to 50 mJy have been masked, there is consequently less power compared to HFI. The green triangles (Amblard, priv. comm.) show the SPIRE CIB measurements identical to Amblard et al. (2011), but without a flux cut applied and thus they are directly comparable to the HFI measurement. They should agree with HFI, but are a factor ~1.7 and ~1.2 below the HFI CIB data points for 400 < ℓ < 1500 at 857 and 545 GHZ, respectively. Indeed, they suffer from an overestimate of the cirrus contamination (by a factor 2). Moreover, preliminary cross-calibration between SPIRE and HFI is increasing the Amblard et al. (2011) SPIRE power spectra by 10 and 20% at 857 and 545 GHz, respectively (see Sect. 5.3 for more details). When corrected from these too factors (cirrus and cross-calibration), the SPIRE (blue triangles) and HFI measurements agree well. For this figure, all SPIRE data points were colour-corrected (colours were computed using the CIB SED of Gispert et al. (2000), integrated through the SPIRE and HFI bandpass filters). Error bars include only statistical errors (for SPIRE, error bars are only shown for the green triangles for sake of clarity).
Current usage metrics show cumulative count of Article Views (full-text article views including HTML views, PDF and ePub downloads, according to the available data) and Abstracts Views on Vision4Press platform.
Data correspond to usage on the plateform after 2015. The current usage metrics is available 48-96 hours after online publication and is updated daily on week days.
Initial download of the metrics may take a while.