Fig. 17
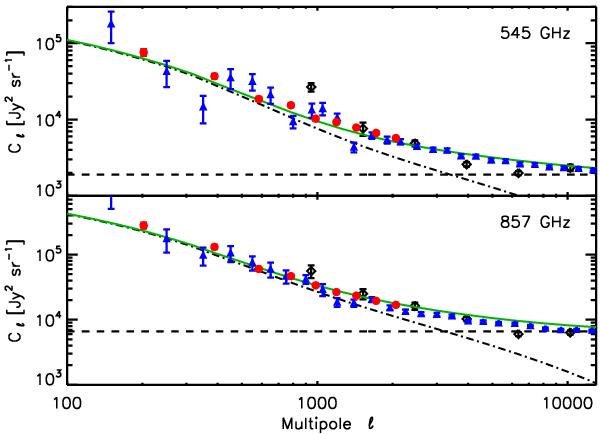
Comparison of BLAST and HFI measurements at 545 and 857 GHz. HFI data points are the red circles; BLAST data points are the black diamonds. They were colour-corrected for the comparison (the colour was computed using the CIB SED of Gispert et al. (2000), integrated through the BLAST and HFI bandpass filters). The dashed line is the BLAST shot noise (also colour-corrected). Also shown is the BLAST best-fit clustering model (black dash-dotted line) and the total contribution (shot noise plus clustering; continuous green line). It provides a good fit to the Planck data. Finally, we report in this figure a revised version of the SPIRE data points from Amblard et al. (2011) (blue triangles from Fig. 18, see text for more details).
Current usage metrics show cumulative count of Article Views (full-text article views including HTML views, PDF and ePub downloads, according to the available data) and Abstracts Views on Vision4Press platform.
Data correspond to usage on the plateform after 2015. The current usage metrics is available 48-96 hours after online publication and is updated daily on week days.
Initial download of the metrics may take a while.