Fig. 16
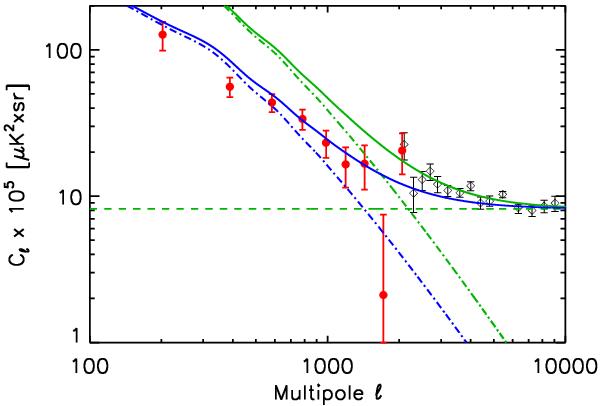
Comparison of SPT (Hall et al. 2010, dark open diamonds) and HFI measurements (red dots) at 217 GHz. The green dashed line corresponds to the SPT shot noise and the green dot-dashed line to the clustering model of Hall et al. (2010), the sum of the two is the continuous green line. The clustering model over-predicts by a factor ≃ 2.4 the HFI power at ℓ ~ 800. The blue dash-dotted line shows the clustering model divided by this factor. The clustering+shot noise (blue continuous line) now under-predicts the SPT data points, which may be the signature of non-linear contributions.
Current usage metrics show cumulative count of Article Views (full-text article views including HTML views, PDF and ePub downloads, according to the available data) and Abstracts Views on Vision4Press platform.
Data correspond to usage on the plateform after 2015. The current usage metrics is available 48-96 hours after online publication and is updated daily on week days.
Initial download of the metrics may take a while.