Free Access
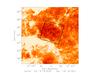
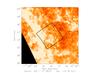
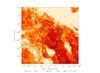
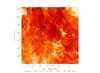
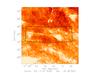
Fig. 1
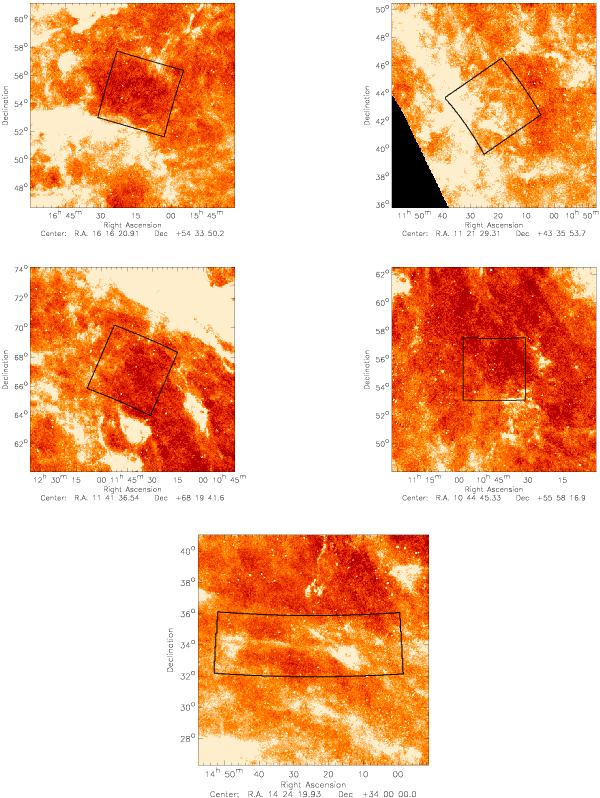
From left to right and top to bottom: N1, AG, SP, LH2 and bootes fields overlaid on IRIS 100μm map (Miville-Deschênes & Lagache 2005). Fields Bootes 1 and 2 are both included in the large rectangle. All IRIS images have the same dynamic range, with a linear colour scale ranging from dark red to white from 0 to 2 MJysr-1.
This figure is made of several images, please see below:
Current usage metrics show cumulative count of Article Views (full-text article views including HTML views, PDF and ePub downloads, according to the available data) and Abstracts Views on Vision4Press platform.
Data correspond to usage on the plateform after 2015. The current usage metrics is available 48-96 hours after online publication and is updated daily on week days.
Initial download of the metrics may take a while.