Free Access
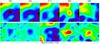
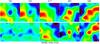
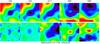
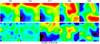
Fig.5
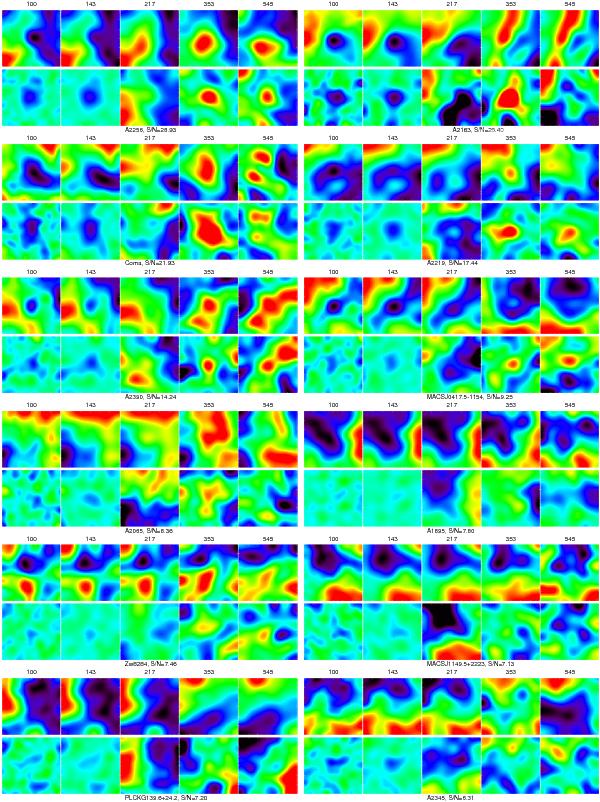
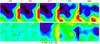
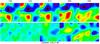
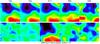
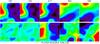
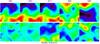
Observations of a few clusters from the ESZ sample. For each cluster, the upper panels show the raw (1 square degree) maps at 100, 143, 217, 353, and 545 GHz. The lower panels show the corresponding cleaned maps (see Sect. 5.2.2). These clusters span S/N from 29 to 6 from the upper left to the lower right.
This figure is made of several images, please see below:
Current usage metrics show cumulative count of Article Views (full-text article views including HTML views, PDF and ePub downloads, according to the available data) and Abstracts Views on Vision4Press platform.
Data correspond to usage on the plateform after 2015. The current usage metrics is available 48-96 hours after online publication and is updated daily on week days.
Initial download of the metrics may take a while.