Fig.3
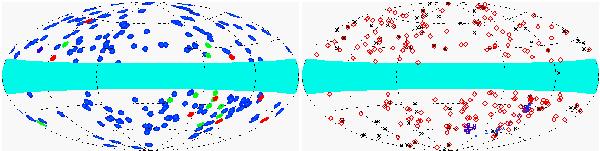
Distribution of ESZ clusters and candidate clusters on the sky (Galactic Aitoff projection). Left panel: in blue are ESZ clusters identified with known clusters, in green the ESZ confirmed candidates, and in red the ESZ candidate new clusters yet to be confirmed. Right panel: in red diamonds the ESZ sample, in black crosses the compilation of SZ observations prior to 2010, in dark blue triangles ACT clusters from Menanteau et al. (2010), and in purple squares SPT clusters from Vanderlinde et al. (2010). The blue area represents the masked area of |b| < 14 deg.

Current usage metrics show cumulative count of Article Views (full-text article views including HTML views, PDF and ePub downloads, according to the available data) and Abstracts Views on Vision4Press platform.
Data correspond to usage on the plateform after 2015. The current usage metrics is available 48-96 hours after online publication and is updated daily on week days.
Initial download of the metrics may take a while.