Free Access
Fig.18
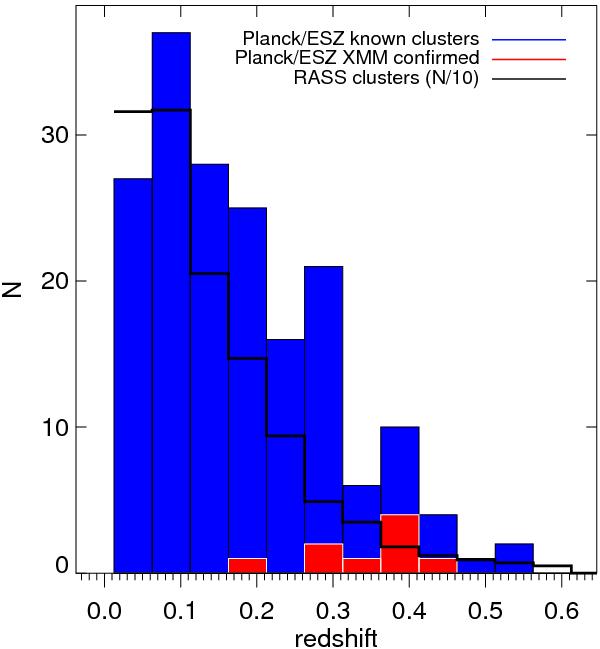
Distribution of ESZ sample in redshift. The 177 identified ESZ clusters with redshift (from optical or X-ray observations) are in blue, the ESZ clusters confirmed with XMM-Newton in red, and the RASS clusters (number density divided by 10) in black solid line.
Current usage metrics show cumulative count of Article Views (full-text article views including HTML views, PDF and ePub downloads, according to the available data) and Abstracts Views on Vision4Press platform.
Data correspond to usage on the plateform after 2015. The current usage metrics is available 48-96 hours after online publication and is updated daily on week days.
Initial download of the metrics may take a while.