Fig.6
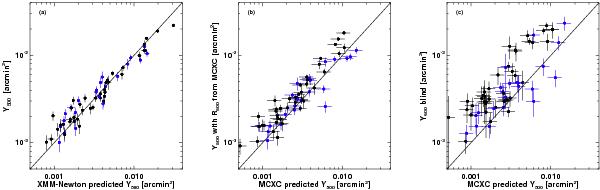
Comparison of the Planck measured SZ flux,
Y500 and the predictions from X-ray measurements,
 . Cool core systems are marked as blue
stars, other systems as black dots. (Left)
YX,500 from XMM-Newton (see
top-left panel of Fig. 5), and
Y500 computed at the position and
θ500 derived from XMM-Newton
measurements. (Middle) YX,500 and
Y500 respectively from
LX,500, and position and
θ500 as given in the MCXC (Piffaretti et al. 2011). (Right)
YX,500 from LX,500
as given in the MCXC, while Y500 are blind
Planck measurements.
. Cool core systems are marked as blue
stars, other systems as black dots. (Left)
YX,500 from XMM-Newton (see
top-left panel of Fig. 5), and
Y500 computed at the position and
θ500 derived from XMM-Newton
measurements. (Middle) YX,500 and
Y500 respectively from
LX,500, and position and
θ500 as given in the MCXC (Piffaretti et al. 2011). (Right)
YX,500 from LX,500
as given in the MCXC, while Y500 are blind
Planck measurements.
Current usage metrics show cumulative count of Article Views (full-text article views including HTML views, PDF and ePub downloads, according to the available data) and Abstracts Views on Vision4Press platform.
Data correspond to usage on the plateform after 2015. The current usage metrics is available 48-96 hours after online publication and is updated daily on week days.
Initial download of the metrics may take a while.