Fig.4
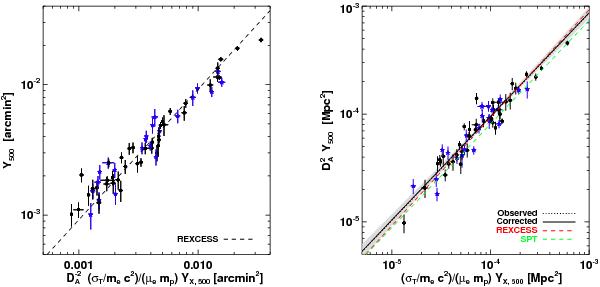
SZ flux vs. X-ray prediction. Blue stars indicate cool core systems. Left panel: relation plotted in units of arcmin2. The dashed line is the prediction from REXCESS X-ray observations (Arnaud et al. 2010). Right panel: relation plotted in units of Mpc2. The SPT results are taken from Andersson et al. (2011).
Current usage metrics show cumulative count of Article Views (full-text article views including HTML views, PDF and ePub downloads, according to the available data) and Abstracts Views on Vision4Press platform.
Data correspond to usage on the plateform after 2015. The current usage metrics is available 48-96 hours after online publication and is updated daily on week days.
Initial download of the metrics may take a while.