Fig.2
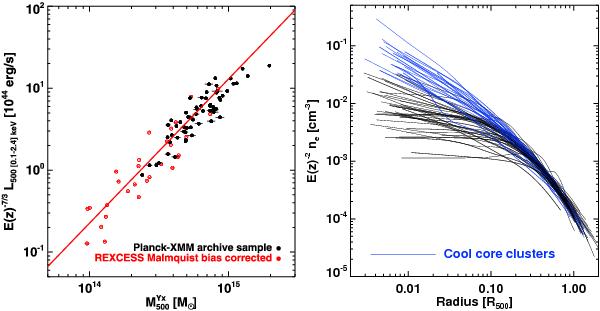
Left: LX,500−M500 relation of the Planck-XMM-Newton archive sample compared to REXCESS, a representative X-ray cluster sample. Luminosity is estimated interior to R500 in the [0.1–2.4] keV band, and mass from the M500−YX,500 relation of Arnaud et al. (2010). The solid red line is the fit to the REXCESS sample only (Pratt et al. 2009). Right: scaled density profiles of the 62 systems in the Planck-XMM-Newton archive sample. Profiles have been corrected for projection and PSF effects as described in the text. Systems classified as cool cores are indicated by blue lines.
Current usage metrics show cumulative count of Article Views (full-text article views including HTML views, PDF and ePub downloads, according to the available data) and Abstracts Views on Vision4Press platform.
Data correspond to usage on the plateform after 2015. The current usage metrics is available 48-96 hours after online publication and is updated daily on week days.
Initial download of the metrics may take a while.