Fig. 4

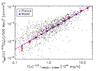
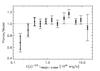
Left: scaling relation between Planck SZ measurements and X-ray luminosity for ~1600 MCXC clusters. Individual measurements are shown by the black dots and the corresponding bin averaged values by the red diamonds. Thick bars give the statistical errors, while the thin bars are bootstrap uncertainties. The bin-averaged SZ cluster signal expected from the X-ray based model is shown by the blue stars. The combination of the adopted  – M500 and L500 – M500 relations (Eq. (6)) is shown by the dashed blue line while the red dot-dashed line shows the best fitting power-law to the data (Eq. (7) and Table 4). Right: ratio between data and model bin averaged values shown in the left panel. Error bars are as in the left panel.
Current usage metrics show cumulative count of Article Views (full-text article views including HTML views, PDF and ePub downloads, according to the available data) and Abstracts Views on Vision4Press platform.
Data correspond to usage on the plateform after 2015. The current usage metrics is available 48-96 hours after online publication and is updated daily on week days.
Initial download of the metrics may take a while.