| Issue |
A&A
Volume 536, December 2011
|
|
|---|---|---|
| Article Number | A97 | |
| Number of page(s) | 6 | |
| Section | Stellar structure and evolution | |
| DOI | https://doi.org/10.1051/0004-6361/201016397 | |
| Published online | 16 December 2011 | |
Do novae have optically thick winds during outburst with large deviations from spherical symmetry?
UPMC-CNRS, UMR 7095, Institut d’Astrophysique de Paris, 98bis boulevard Arago, 75014 Paris, France
e-mail: This email address is being protected from spambots. You need JavaScript enabled to view it.
Received: 22 December 2010
Accepted: 10 October 2011
Abstract
Context. The evidence for the presence of optically thick winds that are produced by classical novae after optical maximum has been challenged in recent papers. In addition, signs of orbital phase-dependent photometric variations, sometimes seen quite early in the development of nova outbursts, are hard to interpret in the framework of optically thick envelopes and especially winds.
Aims. A general discussion of the assumption of optically thick winds with increasing ejection velocities during the early stages of novae after their explosion is needed, also to clarify ideas about novae and in particular to contribute to the understanding of the behaviour of novae V1500 Cyg and V1493 Aql, which show phase-dependent variations during the very early decline after the outburst.
Methods. We considered possible ways of overcoming the apparent contradiction of phase-ependent variations through the production of deviations from spherical symmetry of the winds and made order-of-magnitude estimates for different theoretical scenarios that might produce these deviations.
Results. We found that large deviations from the spherical symmetry of the optically thick winds in early phases after the explosion can easily explain the problem of variations. In particular, the presence of a magnetic field might have had a non-negligible effect on the wind of V1500 Cyg, while at the present there is not enough information available concerning V1493 Aql.
Conclusions. Optically thick winds/envelopes are almost certainly present in the early stages after the optical maximum of a nova, while it is difficult to make pure Hubble-flow models fit the observations of those stages. New more detailed observational and theoretical work, in particular including the effects of magnetic fields on the winds, is needed.
Key words: stars: winds, outflows / novae, cataclysmic variables / stars: individual: V1493 Aql / stars: individual: V1500 Cyg
Deceased on October 22, 2011.
© ESO, 2011
1. Introduction
Observations of novae soon after maximum brightness in the optical appear to require the presence of expanding optically thick envelopes and probably winds, hiding the central remnant (e.g. Friedjung 1996; Short et al. 2001). An envelope consists of circumstellar material, while a wind with continuous ejection from a central star is a special case. In this situation one does not usually expect to observe photometric variations that depend on the orbital phase of the binary in the very early stages after maximum. However, in a few cases, phase-dependent orbital variations seen very early after the nova outburst appear to pose a challenge to any optically thick envelope theory, including in particular those that include optically thick winds. Models based on instantaneous ejection of a thick envelope with a linear gradient of velocity, or “Hubble flow” models, might seem to fit the observations better, provided that the envelope started to become optically thin when the variations are observed. Here we first describe the two types of models and then give reasons in some detail for the assumption that the optically thick envelopes of classical novae after optical maximum contain winds whose velocities increase with time.
Following that discussion we examine two novae in detail that show photometric variations of the order of magnitude of the orbital period, very soon after optical maximum. Finally, we try to see how the variations might be produced because of deviations of the winds from spherical symmetry.
2. Processes in classical nova outbursts
Following their explosions, classical novae show complex phenomena, whose interpretation is not obvious. Observations indicate the presence of regions that produce line absorption and line emission with different velocities, belonging to what are called the “pre-maximum”, “principal”, “diffuse-enhanced”, and “Orion” systems. Each system tends to produce P Cygni profiles with absorption components of many spectrum lines whith very similar Doppler shifts, as well as central emission. These profiles of different systems are often superposed. Each P Cygni profile can be understood as being produced by material that expands with a well-defined range of velocities, which becomes visible at different times. In this situation, the interpretation of spectral line profiles requires care. Classical work showed using photographic spectra that the “pre-maximum” system absorption components that are seen before optical maximum had a velocity that sometimes decreased with time; the somewhat higher velocity “principal” system appeared around maximum, while the former system disappeared soon after. According to this work, the Doppler broadening of the emission lines of the principal system is that of the emission lines of the ejected nebula seen in the late “nebular” stage, though weak “Orion” emission wings have sometimes been seen in the that stage (Payne-Gaposchkin 1957). The higher velocity “diffuse-enhanced” system usually appears some days later than the principal system. Lines from more ionised atoms belong to the Orion system, which often (but not always) has a higher velocity than the diffuse-enhanced system. Hence, systems with higher velocities tend to appear later than those with lower velocities. Absorption components of different systems with different ionisations, such as those of the principal and Orion systems, are simultaneously visible over typical timescales of weeks. The velocity distribution and geometry are quite hard to interpret. This is why there have been strong disagreements over the years between different researchers who studied the processes of classical novae in the early stages after their explosions. These disagreements involve the geometry and velocity field of the ejected envelopes: either an ejection is almost instantaneous, or optically thick (in the continuum) winds play a major role in a continued ejection.
The first point of view is discussed in a recent review by Shore (2008). The model he supports is one of “instantaneous ejection type II” or Hubble flow, where a geometrically thick envelope has a linear gradient of velocity after an initial acceleration, with the velocity increasing outwards. The highest velocity material has travelled the farthest and there is little change in the velocities and geometry during the subsequent evolution of the envelope. Note that models involving a Hubble flow have been quite successfully applied to supernovae. According to this model, an inhomogeneous nova envelope has both an inner and an outer edge, while a still expanded white dwarf that undergoes nuclear burning could still lie below the inner edge. The optical thickness of the envelope decreases with time and the inner, more slowly expanding regions at greater optical depths become visible in later stages of post-maximum nova development. Shore (2008) explains the shapes of certain emission line profiles with this model. The narrowing with time of the Doppler-broadened emission line profiles, seen sometimes after optical maximum, might in addition be considered as strong evidence for Hubble flow because of the increasing visibility of the more slowly expanding material with time. However, Hubble flow neither explains the emission-line widening that is often observed in earlier stages after maximum (see Table 1), nor the rounded line-profiles typical of windsthat are seen in the earlier stages of, for instance, V603 Aql (Payne-Gaposhkin 1957) and V4169 Sgr (Scott et al. 1995).
3. Evidence for the presence of optically thick winds during outburst
Models adding opticaly thick winds are more elaborate because they must account for the complex phenomena revealed by the optical and ultraviolet observations of classical novae. As discussed in early papers by McLaughlin (1947, 1965), the outwards expansion velocities are higher in deeper layers, which are nearer the centre of the exploding star soon after optical maximum. More recently Seitter (1990) arrived at similar conclusions. McLaughlin explained the greater excitation/ionisation of the high-velocity systems as being caused by material in the more central regions of the envelope nearer the source of ionising radiation. From UV observations of nova V1974 Cyg Cassatella et al. (2004) found that when the velocities of absorption lines belonging to the same system were compared, the velocities of lines of the more ionised atoms were somewhat higher (70 km s-1 between the Fe iii lines and the Fe ii lines belonging to the principal system).
There are other more precise reasons why it is necessary to assume the presence of optically thick envelopes with increasing ejection velocities during the early stages after the explosions of classical novae. In the two papers of McLaughlin this conclusion is drawn when line emission and absorption from different systems are superposed. For instance, in the spectrum of DQ Her the principal system absorption of Sc ii 4247 Å remained strong and sharp in the longwards wing of the diffuse-enhanced emission of Fe ii 4233 Å. Moreover, this slowly developing nova showed partial or complete obliteration of the diffuse-enhanced absorption by overlying principal emission. The strong diffuse-enhanced Si ii multiplet (19) 6371 Å absorption was obliterated in late February 1935 by [O i] emission, unlike the Si ii 6347 Å line belonging to the same multiplet. A similar argument was given by McLaughlin for the obliteration of the strongest multiplet (19) line of Ti ii at 4395 Å in the spectrum of that nova. McLaughlin gives the same argument for the Orion system absorption of multiplet (1) N iii lines in the spectrum of the fast nova V603 Aql. When one of these lines was absent, it had shifted into coincidence with an emission maximum of O ii of the principal system.
What is decisive is the result of combining ultraviolet continuum observations with information derived from absorption-line radial velocities. Cassatella et al. (2002) found that the ultraviolet spectra of classical novae generally show a change in the continuum colour-temperature with decreasing optical brightness after optical maximum, which is also shown by the appearance of lines of atoms with increasing ionisation as the nova fades in the optical (Cassatella et al. 2005). The measurements in 20 Å wide UV bands at 2885 Å and 1455 Å, which are free of strong line emission and absorption, indicate a rising colour-temperature soon after optical maximum, which can later fall, possibly because of a contribution of the Balmer continuum. The rising colour-temperatures are suggestive of a shrinking photosphere. This conclusion is also reached by just assuming the bolometric luminosity constant during the fading of the optical continuum. The photosphere, which according to Cassatella et al. (2004) lasts about t3, the time to fade three magnitudes, may have a size not much smaller than the whole envelope near maximum, because the beginning of the explosion is normally only a few days before maximum. For example, it was only about five days before maximum for V1974 Cyg (Cassatella et al. 2004). Soon after that, the envelope is much larger than the photosphere. A detailed study by Friedjung (1987a) of FH Ser, empirically fitting the energy distribution from the ultraviolet to the near-infrared with a Planck distribution, indicated that the photosphere had shrunk by a factor of more than five over several weeks. Non-LTE modelling of the spectrum of V1974 Cyg by Short et al. (2001) also indicated a photospheric shrinkage by about a factor of 3, the photosphere was in this case defined as the region where the continuum optical depth at 5000 Å was equal to unity. In the case of a Hubble flow, as already stated, more slowly expanding material should have become more visible with time, as the optical thickness of each layer of the envelope decreased. But in fact V1974 Cyg showed an increase with time of the velocity of the principal system absorption, as it usually occurs for classical novae. The same comment is also true for the diffuse-enhanced absorption lines of V1974 Cyg.
The behaviour of nova emission lines is less clear-cut (Table 1), but narrowing was seen when the width was only measured after the appearance of the diffuse-enhanced system, as for V603 Aql, V 382 Vel and 1974 Cyg. Their emission line narrowing can then be associated with decreasing emission from the diffuse-enhanced system compared with that of the principal system, which can be both caused by a decreasing wind mass-loss rate and increasing ionisation with time of principal system material. V1500 Cyg is particularly instructive because the appearance of diffuse-enhanced absorption (Duerbeck & Wolf 1977) was associated with rapid line-widening (Friedjung et al. 1999), followed by slower line-narrowing (Boyarchuk et al. 1976).
Temporal behaviour of typical novae.
Therefore, after the disappearance of the pre-maximum system, observations appear to require the presence of an optically thick wind, whose velocity increases with time, formed inside another region that produces the principal system. The optical thickness of the latter becomes small after optical maximum, which allows higher velocity deeper levels to become visible. The higher velocity regions of the wind in deeper layers should be then ejected later as long as this wind lasts. The ejection of the diffuse-enhanced and Orion systems appears to be part of the same physical process, that is, wind production, directly related to the photospheric radius and the mass ejection rate at a particular time. Indeed, using photospheric radii derived from Zanstra-type temperatures, Friedjung (1966) found that the diffuse-enhanced system absorption-component velocities of V603 Aql, RR Pic and DQ Her, which had post-optical maximum oscillations in their light curves, corresponded to what would be expected for the varying Orion system absorption component velocity, when the decreasing photospheric radius was very large. That suggests that the material producing the lower velocity diffuse-enhanced absorption should be ejected earlier, (i.e. when the photosphere is larger) than that producing the Orion system. Let us also consider that the disappearance of the diffuse-enhanced system absorption has been explained by the collision of a faster moving inner discrete shell with that of the principal system; this explanation was also recently suggested by Cassatella et al. (2004) for V1974 Cyg. However, what may be involved could rather be the collision of an absorbing cloud of the diffuse-enhanced system in the line of sight.
Let us note that a short-lived Hubble flow before optical maximum during the “fireball” stage can explain the properties of the pre-maximum system. The velocity of its absorption components sometimes decreases with time; a very large effect of this kind was observed for DQ Her. Perhaps velocity decreases of that system would be observed for all novae if they were observed early enough. The always higher velocity of the principal system absorption component shown by Payne-Gaposchkin (1957) for classical novae after maximum suggests that the principal system material sweeps up all those parts of the pre-maximum system that have a lower velocity. Friedjung (1987b) indeed suggested that the principal system is formed by the sweeping-up of pre-maximum material by the faster optically thick wind. Difficulties with this explanation were found, however, by Cassatella et al. (2004) in their analysis of V1974 Cyg, so the situation appears to be less simple.
X-ray observations also suggest the presence of a wind, though they do not indicate whether the wind is optically thick in the optical. A shock front may be expected to be formed between a wind and the region of formation of the principal system, with the production of hot plasma and X-rays. A general review of X-ray observations has been given by Krautter (2008). Some of the observed X-rays are soft and are understood as being emitted by a hot white dwarf remnant in later stages of its post-optical-maximum development. Harder X-rays with energies higher than ~1 KeV are most probably produced in a hot shocked plasma. O’Brien et al. (1994) performed theoretical calculations involving collisions between material ejected at different velocities, with a fast wind blowing out the confining slow wind. These authors gave an explanation for the detected X-rays of 838 Her, though their assumed constant mass loss rate of 4.74 × 10⁻⁶ M⊙ yr-1 seems not realistic. Many other observers have also detected hard X-ray emission, such as Balman et al. (1998), who derived a maximum luminosity of 0.8–2.0 × 1034 erg s-1 for V1974 Cyg. Mukai & Ishida (2001) and Orio et al. (2001) studied X-ray emission of V382 Vel. Tsujimoto et al. (2009 found for V458 Vul that a single temperature (0.64 KeV) hot plasma with a luminosity of 6 × 1034 erg s-1 in the 0.3–3 Kev-band and an emission measure of 7 × 1057 cm-3 caused by the collision between a wind and slower moving outer material may well explain the observations. Results of later observations of X-ray emission with the Swift satellite are given in recent papers, such as those by Page et al. (2009) of V598 Pup and by Ness et al. (2009) of V2491 Cyg. Page et al. (2009) explain the observed late hard X-ray emission of V598 Pup between 147 and 255 days after the outburst by collisions between material having differential motion between 400 and 800 km s-1. However, Russel et al. (2007) found that the infrared lines had a HWFM of 2000 km s-1, so the X-ray production there may have involved more complicated physics.
The nova hard X-ray luminosity can be compared with the total X-ray luminosity of normal O stars, where X-rays are thought to be produced by collisions inside their winds. Nazé (2009) found from XMN-Newton observations that the mean log ratio of O-star 0.5–10 KeV X-ray emission to the bolometric luminosity was − 6.45 ± 0.51. Using the basic stellar parameters of Drilling & Landolt (2000), this result for an O5 main sequence star would correspond to a flux of 1.2 × 1033 erg s-1, which is considerably lower than, for instance, the above value for hard X-rays of V1974 Cyg.
Finally let us note following the X-ray discussion that collisions involving the wind and slower moving outer material, as for spherical symmetry studied by O’Brien et al. (1994), have not been sufficiently examined up to the present time to give predictions for novae of different classes. In addition, instabilities can occur with the wind breaking up the principal system formation region. In that way, holes and separate clouds may be created. Some of the faster unshocked cooler material might therefore overtake the lower velocity clouds and then settle down into a Hubble flow after the disappearance of the wind. In addition, material belonging to the fastest regions of the pre-maximum system that were not swept up by the principal system material could also still be present and contribute to a Hubble flow. Such a situation is difficult to calculate, which makes numerical estimates unreliable. Indications of that sort of structure of the ejected nebula of V1974 Cyg two years after outburst, with faster moving material at the outside, were given by Panagia (2002). In this connection we can also mention the work of Ederoclite et al. (2006) on V5114 Sgr, who found that the mass of Hα-emitting clumps as well as their filling factor decreased with time; this can be explained if the clumps dissolved slowly into lower density more massive material, producing less emission.
We can conclude that though much more work remains to be done to understand all processes involved and to refine the observational evidence, models including optically thick winds are much more plausible to explain many different sorts of observation. Nevertheless, at both very early and quite late times, the kinematics of certain regions can be one of a Hubble flow. A nova wind, unlike the more common O-star winds, can in principle be accelerated by radiation pressure at high continuum optical depths, as for instance discussed by Friedjung (1966) and Kato & Hachisu (1994).
4. Novae with periodic photometric variations very early after the optical maximum
Photometric variation with a period consistent with the orbital period of the nova binary systems has been observed in a number of novae after the optical maximum. Here we discuss the most significant cases of two fast novae.
A classical case of such variations is V1500 Cyg, which showed periodic photometric variations as early as 10 days after maximum and perhaps even 5 days after maximum according to Rosino & Tempesti (1977). The spectroscopic line profiles showed signs of even earlier variations at about 3 days after maximum according to Hutchings et al. (1978). This nova is now understood as being a polar, that is, as containing a white dwarf with a very strong magnetic field. In this framework, the decrease of period, understood as being the white dwarf’s rotation period (which is not far from the orbital period), can be explained as well. The periodic photometric variations found by Campbell (1976) were interpreted by a model with spherical symmetry. Hutchings et al. (1978) proposed a rotating searchlight model, with a polar axis inclined 50° to the line of sight. In later work Horne & Schneider (1989) studied 1981 radial velocity and flux variations. These authors concluded that the emission lines arose near the secondary component of the binary. According to them, the binary inclination was equal to, or exceeding 40°.
It should be noted that the emission lines of highly ionised atoms appeared later than the periodic variations of V1500 Cyg, according to the observations of Rosino & Tempesti (1977) and Hutchings et al. (1978). For example, He ii, produced by the recombination of twice ionised helium, was only detected two weeks after maximum, which can be explained by supposing that radiation was absorbed at earlier dates that was able to doubly ionise helium at wavelengths where the optical thickness of the wind was high, without needing to suppose deviations from spherical symmetry.
It is necessary to emphasize that the proposed deviations from spherical symmetry are those of the wind, which need not be those of the massive outer envelope. The rapidly disappearing wind would appear to have much less mass than the latter. Slavin et al. (1995) found that the image of the nebular ejecta of V1500 Cyg was nearly circular with randomly scattered enhancements; in addition the authors proposed a correlation between the aspect ratio of the nebular ejecta and the speed of development of novae after optical maximum, so that faster developing novae like V1500 Cyg have more spherical envelopes. However, Downes and Duerbeck (2000) were doubtful of the statistical significance of the correlation.
The short period variations of V1493 Aql appear to be much more difficult to explain in a framework of spherical symmetry. Photometric variations with a period of 0.156 days were observed, the first signs being seen only 5 days after maximum, as found by Dobrotka et al (2005) and by Novak et al. (1999). The light curve moreover suggests the presence of eclipses. The development of this nova after maximum was slower than that of V1500 Cyg, with a value of t3 of 7 days (see Table 1). The lines seen in the spectrum appear to be not those characteristic of a high-temperature small central object, which would be needed for its luminosity to be near the Eddington limit. Therefore, Friedjung et al. (2006) and Dobrotka et al. (2006) concluded that V1493 Aql was an object with a much lower luminosity than that of a classical nova. On the other hand, most of the light curve of V1493 Aql, (except for the secondary peak, which Hachisu & Kato (2010) suspected to be caused by a magnetic field), and the light curve of V1500 Cyg, fit the universal decline law for the brightness of classical novae. Bonifacio et al. (2000) found for V1493 Aql a non-classical time variation in B − V, with the nova being apparently bluer near maximum.
There is much less information for the less observed V1493 Aql than for the well observed V1500 Cyg. In fact, the distance of the former of 4–5 kpc (Arkipova et al. 2002; Hachisu & Kato 2010) is more than four times that of the latter. Even much longer distances of 19 kpc and 26 kpc are estimated by Bonifacio et al. (2000) and Venturini et al. (2004).
5. Deviations from spherical symmetry
Obviously, a solution to the problem of variations over an orbital period early in the development of a nova after its explosion is possible, if the optically thick wind (or envelope) considerably deviates from spherical symmetry. In particular, if the wind is considerably stronger near the poles with a significantly higher optical depth than near the equator, it might be possible to detect eclipses of the central binary. In that case the inclination of the orbit should be high. Explanations involving the presence of the companion star, rotation of the source of the wind and/or magnetic fields can indeed be imagined.
Presence of the companion star
According to nova wind models, the companion star should be revolving in deep layers of the wind soon after maximum. One might expect, in a rather simplistic way, that these effects would produce a spiral disturbance in the wind, as was indeed suggested by Fabian & Pringle (1977). The bottom of the spiral should rotate with the orbital period, while if angular momentum is conserved in the wind, the top moves much more slowly, producing only long timescale variations. As the mass flux of the wind decreased, radiation from lower more rapidly rotating parts of the spiral would escape, so the variations would become more easily detectable. The period of these variations would decrease during the mass flux decrease, which is rapidly in the case of rapidly developing novae after maximum like the fast novae V1500 Cyg and V1493 Aql. However, the observed variations are not of this nature.
According to the models of Kato & Hachisu (1994), the “drag” luminosity produced by the companion star’s motion in the outflow should be small in most cases. However, their calculations, made only for a one-dimensional model, are unsuitable for predicting the extent to which there should be differences between the wind in the plane of the orbit and perpendicularly to that plane. Better “2.5D” calculations (according to the authors) of the effects of the underlying binary system were performed by Lloyd et al. (1997). They take the “common envelope phase” into account, when the binary is far below the photosphere. The frictional drag of the companion star causes orbital energy and angular momentum to be transferred to the ejecta, resulting in a highly anisotropic flow. The calculations permit rotation about the symmetry axis, though the flow is constrained to be axisymmetric. The ejection velocity increases with time. Fast novae with high ejection velocities produced envelopes that were more spherical, while very low initial ejection velocity novae produced envelopes with density enhancements along the polar axis. However, the two novae described above, with photometric variations early in their post-optical maximum development, were fast with high ejection velocities. It is therefore not clear to what extent these calculations are relevant for the present problem.
Rotation
Rotation has been invoked by other authors to explain asymmetries of the ejected envelope. Scott (2000) considered the cooling of the equatorial regions relative to the polar regions of the underlying white dwarf if it were rotating fast. In that case the pressure of the layers and the Fermi temperature needed to break electron degeneracy and produce a thermonuclear runaway would be higher at the poles. The rate of energy production is indeed extremely sensitive to the temperature, and material ejected early in the outburst can show departures from spherical symmetry because of rotation. Other effects are needed, however, to shape the wind.
Scott (2000) recalled that the critical point of a rotating wind will be higher near the equator, where the terminal velocity is higher. In addition, the flow near the equator is hindered by a “centrifugal barrier”. The author quotes work by Ruggles & Bath (1979) and by Kato & Hachisu (1994), who predicted higher photospheric wind velocities when the critical radius is smaller, but the author made no calculations on winds himself. Lamers & Cassinelli (1999) discussed rotating winds more generally, both for winds driven by radiation pressure in the lines and for outflowing disks around stars. For line-driven winds effects become important with a rotation velocity above half that of breakup (Friend & Abbott 1986). There is good evidence for outflowing disks around Be and B[e] stars; the suggested bi-stability mechanism for their production depending on the optical thickness in the Lyman continuum is not relevant to the present discussion of winds accelerated at a high continuum optical depth.
However, Owocki (2004) pointed out that previous calculations such as those of Friend & Abbott (1986) gave incorrect results because they did not take into account gravity darkening caused by von Zeipel’s theorem. Similar considerations apply to winds of “normal” hot stars driven by radiation pressure in spectral lines and those driven by radiation pressure acting on opacity of the continuum, as in the case of porosity modulated winds driven by a luminosity above the Thomson-scattering Eddington limit studied by Shaviv (2001). Outwards “centrifugal acceleration” reduces the effective gravity near the equator. Owocki (2004) examined the situation of a critical point near the stellar surface. If von Zeipel’s theorem describes gravity darkening, the stellar radiation flux scales with the effective gravity, taking into account the “centrifugal force”. Then 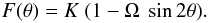 Here F is the stellar surface radiation flux and K is a constant. Ω, the ratio of centrifugal force to gravity at the equator equals V2rotR/GM, in terms of the stellar rotation velocity Vrot, radius R, and mass M. θ is the co-latitude. Then the effective Eddington parameter, which equals the ratio of radiative acceleration to effective gravity, is independent of latitude. When the distribution of the opacities of lines in the case of line-driven winds in CAK theory follows a power law, the mass flux at co-latitude θ turns out to be
 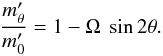 The result is that the wind is weakest near the equator. The same sort of calculation can be made for the above mentioned poroosity modulated winds. Again assuming von Zeipel’s theorem, the same expression is found for
  , when the luminosity is far above the Eddington limit (see Owocki 2004). Clearly, as also for other sorts opacity variation, these rotational effects will only be large when the slowly moving layers near the base of the wind are not too far from rotational breakup. In the case of V1500 Cyg, for which the information is available, the rotation velocity of the white dwarf in quiescence of the order of a few km s-1 is far below the velocity of the rotational breakup of the order of several thousands of km s-1. Ejection of a wind from originally slowly moving outer layers of a white dwarf during the development of a nova outburst would make the situation worse for any effect involving rotation, if the angular momentum of the ejected material were conserved.
Magnetic fields
Magnetic fields will have a major effect if the magnetic pressure is not much less than the pressure accelerating the wind. In order to make very approximate order of magnitude estimates, which can be indications about the conditions what are when magnetic fields start to become important, it is easiest at the present stage of knowledge to refer to published calculations, assuming the continuity equation for spherical symmetry. These estimates will fail when magnetic fields are stronger.
Kato & Hachisu (1994) made calculations for optically thick winds, where acceleration by a locally super-Eddington luminosity occurs above the critical point owing to a change of the theoretical OPAL opacity of the flow. In lower layers the acceleration is driven by gas pressure, and we can use the authors’ Fig. 4 for a wind of a 1.0 M⊙ white dwarf with critical points at 0.2 R⊙ and 0.65 R⊙ to approximately estimate the gradients of gas pressure there. The order of magnitude of the gradient of the gas pressure accelerating the wind (vd(ρv)/dr) (ρ being the density, v the wind velocity and r the distance from the centre of the wind) should be compared with the order of magnitude of the gradient of the pressure of the magnetic field d/drH2/(8π) needed to produce substantial deviations of the wind from spherical symmetry. When the continuity equation for spherical symmetry is valid, ρv varies as r-2 and the pressure gradient of the wind equals 2vρ0v0(r0/r)21/r with v0 and ρ0 the values of v and ρ at a reference radius r0, which we shall take as that at the critical point. A dipole field varies at long distances from the dipole as r-3 and the gradient of the pressure of the magnetic field equals  , with H0 equal to H at r = r0. We find that for the two critical points of 0.2 and 0.65 R⊙, magnetic fields of about 104.5 and 103 Gauss are required near the white dwarf surface to have a substantial effect on a spherically symmetric wind at r = r0.
No detailed models of the porous winds studied by Shaviv (2001) are available, for which the effect of magnetic fields can be estimated. However, Kato & Hachisu (2005) modelled the Thomson-scattering super-Eddington luminosity of V1974 Cyg with an artificially reduced opacity to take into account the clumpiness of the envelope. The fairly similar results for different reduction factors of the luminosity with a white dwarf mass of 1.0 M⊙ are shown in the authors’ figure. The average position of the critical point is at 1011 cm. The magnetic fields at r = 108.8 cm, needed to have a substantial effect in accelerating the wind near the critical point, are then of the order of 106 Gauss.
The white dwarf of V1500 Cyg has a strong magnetic field, of the order of 25 Mega Gauss according to the estimates quoted by Warner (1995) in his Table 6.8. Our estimates of the effect of a magnetic field indicate that it might produce major deviations from spherical symmetry of its wind during outburst. As we have seen, modelling of the system by Hutchings et al. (1978) and by Horne & Schneider (1989) suggest a steep inclination of the polar axis to the line of sight of more than 40°, so the wind could be weak in the direction of the line of sight.
Much less can be said about V1493 Aql, which is farther away. It is not in the Chandra X-ray source catalogue, and its problem will require additional studies.
6. Conclusions
Firstly, we have emphasized that optically thick winds are almost certainly present in the early stages of a nova after its optical maximum. Conversely, it is difficult to make rival pure Hubble flow models fit the observations of those stages.
The winds may deviate considerably from spherical symmetry with a maximum mass loss along the polar axis, while when the total mass in the wind is small compared with the total mass of the envelope, most ejected mass can be concentrated at the same time in a nearly spherical envelope. These deviations may enable variations with a period of the order of the orbital period to be detectable soon after optical maximum. This could be the case for V1500 Cyg, whose wind could be strongly affected by its magnetic field, but much less can be now said about V1493 Aql. The order of magnitude estimates given in the present paper are intended to stimulate more detailed theoretical and observational work; in particular including the effects of magnetic fields could be crucial.
Acknowledgments
The author must thank Izumi Hachisu and Stan Owocki for useful discussions, as well as an anonymous referee, who made useful suggestions on the first draft of this paper. Roberto Viotti improved the style.
References
- Andrillat, Y., & Houziaux, L. 1987, A&AS, 67, 111 [NASA ADS] [Google Scholar]
- Annuk, K., Kolka, I., & Leedjarv, L. 1993, A&A, 269, l5 [Google Scholar]
- Arkipova, V. P., Burlak, M. A., & Esippov, V. F. 2002, Astron. Rep., 28, 100 [Google Scholar]
- Balman, S., Krautter, J., & Ögelman, H. 1998, ApJ, 499, 395 [NASA ADS] [CrossRef] [Google Scholar]
- Bonifacio, P., Selvelli, P. L., & Caffau, E. 2000, A&A, 356, L53 [NASA ADS] [Google Scholar]
- Boyarchuk, A. A., Galinka, T. S., Gershberg, R. E., et al. 1976, Sov. Astron. Lett., 2, 166 [NASA ADS] [Google Scholar]
- Campbell, B. 1976, ApJ, 207, L41 [NASA ADS] [CrossRef] [Google Scholar]
- Cassatella, A., Altamore, A., & González-Riestra, R. 2002, A&A, 384, 1023 [NASA ADS] [CrossRef] [EDP Sciences] [Google Scholar]
- Cassatella, A., Lamers, H. J. G. l. M., Rossi, C., & González-Riestra, R. 2004, A&A, 420, 571 [NASA ADS] [CrossRef] [EDP Sciences] [Google Scholar]
- Cassatella, A., Altamore, A., & González-Riestra, R. 2005, A&A, 439, 305 [Google Scholar]
- Della Valle, M., Pasquini, L., Daou, D., & Williams, R. E. 2002, A&A, 390, 155 [NASA ADS] [CrossRef] [EDP Sciences] [Google Scholar]
- Dobrotka, A., Retter, A., Hric, L., & Novák, R. 2005, in The Astrophysics of Cataclysmic Variables and Related Objects, ed. J.-M. Hameury, & J.-P. Lasota, ASP Conf. Ser., 330, 363 [Google Scholar]
- Dobrotka, A., Friedjung, M., Retter, A., Hric, L., & Novák, R. 2006 A&A, 448, 1107 [Google Scholar]
- Downes, R. A., & Duerbeck, H. W. 2000, ApJ, 120, 2007 [Google Scholar]
- Drilling, J. S., & Landolt, A. U. 2000, in Astrophysical Quantities, fourth edition, ed A. N. Cox, Springer and AIP Press, 381 [Google Scholar]
- Duerbeck, H. W., & Wolf, B. 1977, A&AS, 29, 297 [NASA ADS] [Google Scholar]
- Ederoclite, A., Mason, E., Della Valle, M., et al. 2006, A&A, 459, 875 [NASA ADS] [CrossRef] [EDP Sciences] [Google Scholar]
- Fabian, A. S., & Pringle, J. E. 1977, MNRAS, 180, 749 [NASA ADS] [Google Scholar]
- Friedjung, M. 1966, MNRAS, 132, 317 [NASA ADS] [Google Scholar]
- Friedjung, M. 1987a, A&A, 179, 164 [NASA ADS] [Google Scholar]
- Friedjung, M. 1987b, A&A, 180, 155 [Google Scholar]
- Friedjung, M. 1996, Mem. Astr. Soc. Ital., 67, 281 [NASA ADS] [Google Scholar]
- Friedjung, M., Mikolajewska, J., & Mikoajewski, M. 1999, A&A, 348, 475 [NASA ADS] [Google Scholar]
- Friedjung, M., Dobrotka, A., Retter, A., Hric, L., & Novák, A. 2006, Astrophys. Space Sci., 304, 317 [NASA ADS] [CrossRef] [Google Scholar]
- Friend, D. B., & Abbott, D. C. 1986, ApJ, 311, 701 [NASA ADS] [CrossRef] [Google Scholar]
- Hachisu, I., & Kato, M. 2010, ApJ, 709, 680 [NASA ADS] [CrossRef] [Google Scholar]
- Horne, K., & Schneider, D. P. 1989, ApJ, 343, 888 [NASA ADS] [CrossRef] [Google Scholar]
- Hutchings, J. B. 1970, Publ. Dom Astrophys. Obs., 13, 347 [Google Scholar]
- Hutchings, J. B., Bernard, J. E., & Margetish, L. 1978, ApJ, 224, 899 [NASA ADS] [CrossRef] [Google Scholar]
- Kato, M., & Hachisu, I. 1994, ApJ, 437, 802 [NASA ADS] [CrossRef] [Google Scholar]
- Kato, M., & Hachisu, I. 2005, ApJ, 633, L117 [NASA ADS] [CrossRef] [Google Scholar]
- Krautter, J. 2008, in Classical Novae, 2nd ed., ed. A. Evans, & M. F. Bode, 232 [Google Scholar]
- Lamers, H. J. G. L. M., & Cassinelli, J. P. 1999, Introduction to Stellar Winds (Cambridge University Press) [Google Scholar]
- Lloyd, H. M., O’Brien, T. J., & Bode, M. F. 1997, MNRAS, 284, 187 [Google Scholar]
- McLaughlin, D. B. 1947, PASP, 59, 244 [NASA ADS] [CrossRef] [Google Scholar]
- McLaughlin, D. B. 1965, in Colloque International sur les Novae, Supernovae, Novoides, CNRS, in discussion 123 also published in AnAp, 1964, 494 [Google Scholar]
- Mukai, K., & Ishida, M. 2001, ApJ, 551, 1024 [NASA ADS] [CrossRef] [Google Scholar]
- Munari, U., Henden, A., Valisa, P., et al. 2010, PASP, 122, 898 [NASA ADS] [CrossRef] [Google Scholar]
- Munari, U., Siviero, A., Dallaporta, S., et al. 2011, New Astron., 16, 209 [NASA ADS] [CrossRef] [Google Scholar]
- Nazé, Y. 2009, A&A, 506, 1055 [NASA ADS] [CrossRef] [EDP Sciences] [Google Scholar]
- Ness, J.-U., Drake, J. J., Beardmore, A. P., et al. 2009, AJ, 137, 4160 [NASA ADS] [CrossRef] [Google Scholar]
- Novák, R., Retter, A., & Lipkin. Y. 1999, IAUC, 7443 [Google Scholar]
- O’Brien, T. J., Lloyd, H. M., & Bode, M. F. 1994, MNRAS, 271, 155 [NASA ADS] [CrossRef] [Google Scholar]
- Orio, M., Parmar, A., Benjamin, R., et al. 2001, MNRAS, 326, L13 [NASA ADS] [CrossRef] [Google Scholar]
- Owocki, S. 2004, in Evolution of Massive Stars, Mass Loss and Winds, ed. M. Heydari-Malayeri, Ph. Stee, & J.-P. Zahn, EDP Sciences, 163 [Google Scholar]
- Page, K. L., Osborne, J. P., Read, A. M., et al. 2009, A&A, 507, 923 [NASA ADS] [CrossRef] [EDP Sciences] [Google Scholar]
- Panagia, N. 2002, in discussion, Mem. Soc. Astron. Ital, 73, 251 [Google Scholar]
- Payne-Gaposchkin, C. 1957, The Galactic Novae, North Holland [Google Scholar]
- Rosino, L., & Tempesti, P. 1977, Sov. Astron., 21, 291 [NASA ADS] [Google Scholar]
- Ruggles, C. L. N., & Bath, G. T. 1979, A&A, 80, 97 [NASA ADS] [Google Scholar]
- Russel, R. W., Rudy, R. J., Lynch, D. K., & Woodward, C. E. 2007, IAU Circ, 8901 [Google Scholar]
- Scott, A. D. 2000, MNRAS, 313, 775 [NASA ADS] [CrossRef] [Google Scholar]
- Scott, A. D., Duerbeck, H. W., Evans, A., et al. 1995, A&A, 296, 439 [NASA ADS] [Google Scholar]
- Seitter, W. C. 1990, in Physics of Classical Novae, ed. A. Cassatella, & R. Viotti, Springer, 79 [Google Scholar]
- Shaviv, N. 2001, MNRAS, 326, 126 [NASA ADS] [CrossRef] [Google Scholar]
- Shore, S. N. 2008, in Classical Novae, 2nd edn., ed. A. Evans, M. F. Bode, Cambridge, 194 [Google Scholar]
- Short, C. I., Hauschildt, P., Starrfield, S., & Baron, E. 2001, ApJ, 547, 1057 [NASA ADS] [CrossRef] [Google Scholar]
- Slavin, A. J., O’Brien, T. J., & Dunlop, J. S. 1995, MNRAS, 276, 353 [NASA ADS] [CrossRef] [Google Scholar]
- Tarasova, T. N. 2007, IBVS, 5807 [Google Scholar]
- Tsujimoto, M., Takei, D., Drake, J. J., et al. 2009, PASJ, 61, S69 [NASA ADS] [Google Scholar]
- Venturini, C. C., Rudy, R. J., Lynch, D. K., et al. 2004, ApJ, 128, 405 [Google Scholar]
- Warner, B. 1995, Cataclysmic Variable Stars (Cambridge University Press) [Google Scholar]
All Tables
Current usage metrics show cumulative count of Article Views (full-text article views including HTML views, PDF and ePub downloads, according to the available data) and Abstracts Views on Vision4Press platform.
Data correspond to usage on the plateform after 2015. The current usage metrics is available 48-96 hours after online publication and is updated daily on week days.
Initial download of the metrics may take a while.