Free Access
Fig. 7
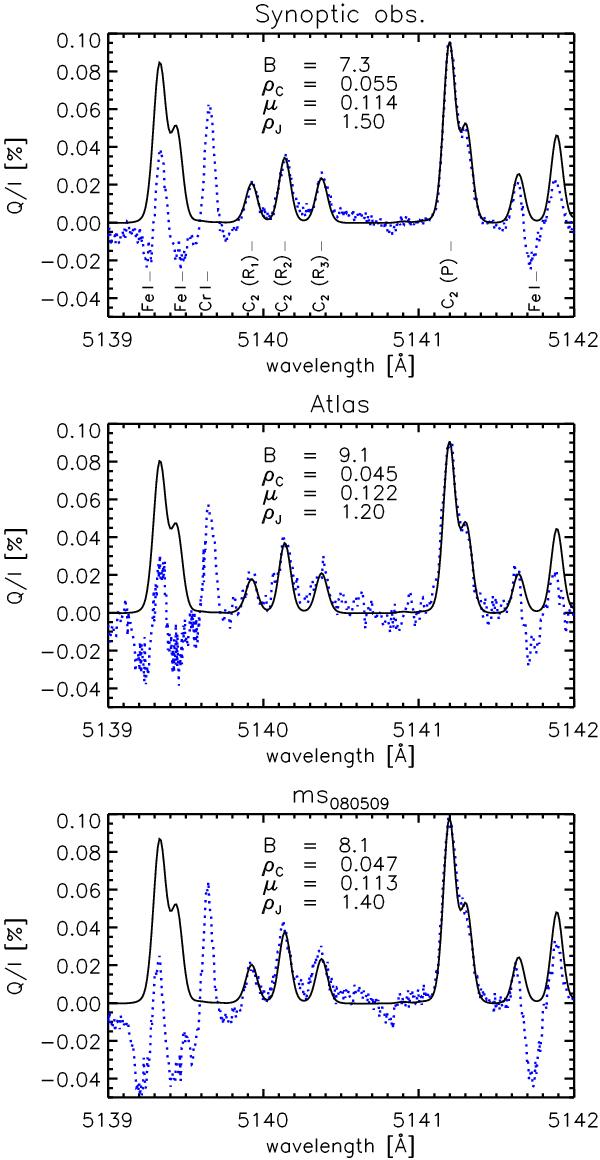
Best fits for Q/I (solid), as determined by the χ2-minimization, to an example synoptic observation, the atlas and ms080509 (dotted, from top to bottom). Blend lines (Fe i and Cr i) were not included for the calculations which explains the large differences below 5139.8 Å.
This figure is made of several images, please see below:
Current usage metrics show cumulative count of Article Views (full-text article views including HTML views, PDF and ePub downloads, according to the available data) and Abstracts Views on Vision4Press platform.
Data correspond to usage on the plateform after 2015. The current usage metrics is available 48-96 hours after online publication and is updated daily on week days.
Initial download of the metrics may take a while.