Fig. 5
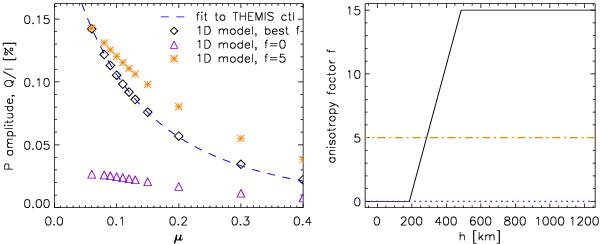
Left panel: the dashed line represents the P amplitude fit to the center-to-limb THEMIS and IRSOL measurements from Paper I. Calculations with a constant anisotropy factor f cannot reproduce these amplitudes (asterisks for f = 5 and triangles for f = 0). The right panel shows the corresponding height dependence of f (dash-dotted line for f = 5 and dotted line for f = 0). It was varied linearly (solid line, right panel), which created a good fit to the measured P amplitudes (diamonds, left panel).
Current usage metrics show cumulative count of Article Views (full-text article views including HTML views, PDF and ePub downloads, according to the available data) and Abstracts Views on Vision4Press platform.
Data correspond to usage on the plateform after 2015. The current usage metrics is available 48-96 hours after online publication and is updated daily on week days.
Initial download of the metrics may take a while.