Fig. 4
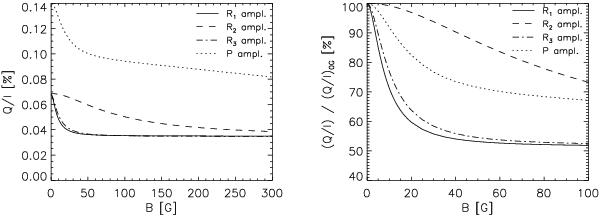
Variation of the absolute Q/I including the continuum polarization with magnetic field. The parameters used for the simulation are: ρC = 0.05, ρJ = 1.5 and μ = 0.11. Left panel: the amplitudes of R1 (solid) and R3 (dash-dotted) decrease very fast and are nearly fully depolarized above 100 G. The critical field strengths of R2 (dashed) and P (dotted) are higher. Right panel: magnification of the region from 0 G to 100 G. The y-axis is scaled with the zero magnetic field Q/I value, i.e. shows the amplitude decrease in percent. Because the continuum polarization is included and not only the line polarization is shown, the ratio does not necessarily decrease to 20% for high B.
Current usage metrics show cumulative count of Article Views (full-text article views including HTML views, PDF and ePub downloads, according to the available data) and Abstracts Views on Vision4Press platform.
Data correspond to usage on the plateform after 2015. The current usage metrics is available 48-96 hours after online publication and is updated daily on week days.
Initial download of the metrics may take a while.