Fig. 2
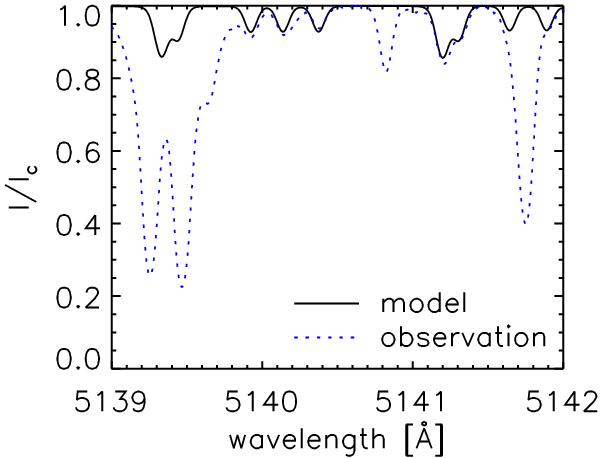
Measured intensity spectrum (dotted) and model calculation (solid). Only C2 lines were taken into account for the calculation, which explains the differences to the observed, deep atomic absorption lines. Some small differences in the C2 lines may be caused by vignetting effects, which could not be fully removed because flatfields were not available for the observations.
Current usage metrics show cumulative count of Article Views (full-text article views including HTML views, PDF and ePub downloads, according to the available data) and Abstracts Views on Vision4Press platform.
Data correspond to usage on the plateform after 2015. The current usage metrics is available 48-96 hours after online publication and is updated daily on week days.
Initial download of the metrics may take a while.