Fig. 1
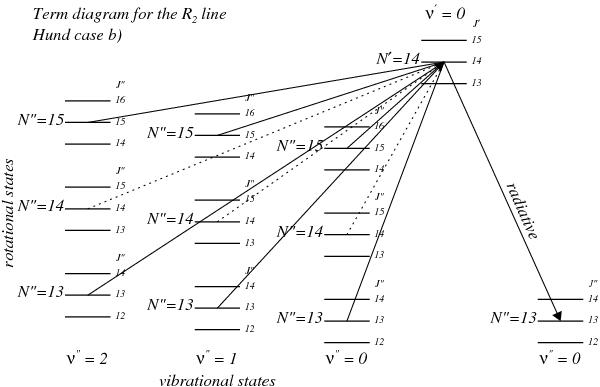
Diagram showing the nine considered transitions for the R2(13) line. The diagrams for all other C2 lines are similar. The energy differences of the levels are not to scale. Primed (′) variables correspond to upper levels and double-primed (′′) variables to lower levels. Dotted lines represent Q-branch transitions, which are significantly weaker than the other transitions. Transitions from satellite branches are not shown because they are even weaker than the Q-branch.
Current usage metrics show cumulative count of Article Views (full-text article views including HTML views, PDF and ePub downloads, according to the available data) and Abstracts Views on Vision4Press platform.
Data correspond to usage on the plateform after 2015. The current usage metrics is available 48-96 hours after online publication and is updated daily on week days.
Initial download of the metrics may take a while.