Free Access
Fig. 15
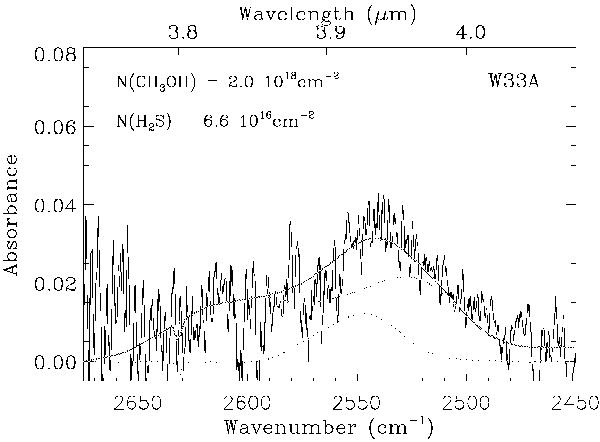
Comparison between our experimental data and the ISO observation of W33A. Dashed line corresponds to the pure CH3OH ice spectrum at 20 K, dotted line corresponds to pure H2S ice at 20 K, and the continuous line is the addition of both spectra.
Current usage metrics show cumulative count of Article Views (full-text article views including HTML views, PDF and ePub downloads, according to the available data) and Abstracts Views on Vision4Press platform.
Data correspond to usage on the plateform after 2015. The current usage metrics is available 48-96 hours after online publication and is updated daily on week days.
Initial download of the metrics may take a while.