Fig. 1
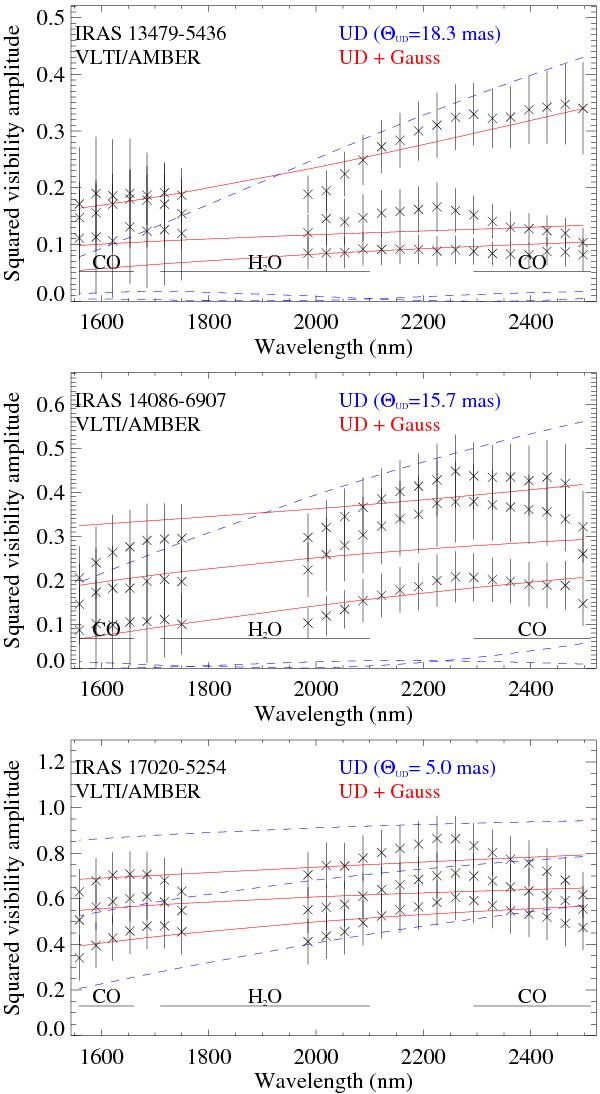
Squared visibility amplitudes as a function of wavelength of IRAS 13479-5436, IRAS 14086-6907, and IRAS 17020-5254 (from top to bottom). The position of H2O and CO bands are indicated. The blue dashed lines show the best-fit of a single component uniform disk model. The red solid lines indicate the best-fit two-component model consisting of a uniform disk describing the central source and a Gaussian disk describing the circumstellar dust shell. The fit parameters of the two-component model are indicated in Table 3. In each panel, the three sets of lines correspond to baselines (from top to bottom) E0-G0, G0-H0, E0-H0 with increasing projected baseline lengths as listed in Table 2.
Current usage metrics show cumulative count of Article Views (full-text article views including HTML views, PDF and ePub downloads, according to the available data) and Abstracts Views on Vision4Press platform.
Data correspond to usage on the plateform after 2015. The current usage metrics is available 48-96 hours after online publication and is updated daily on week days.
Initial download of the metrics may take a while.