Fig. 3
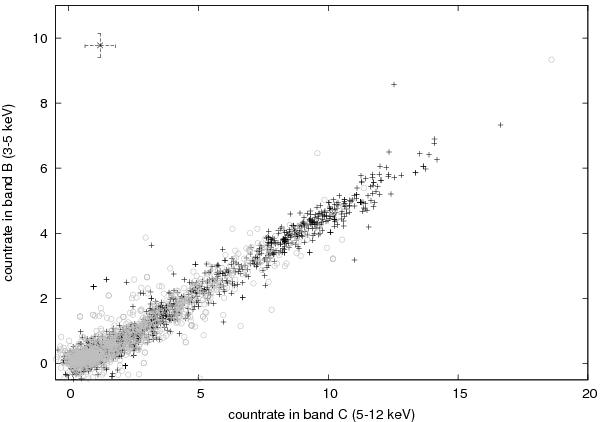
ASM data: countrate in band B (3–5 keV) versus countrate in band C (5–12 keV). The data from MJD 50 087 to 53 501 are marked with a cross to distinguish them from the data between MJD 53 501 to 55 646, which are marked by circles. Typical uncertainties of the data points are indicated by the error bars in the upper left corner of the plot.
Current usage metrics show cumulative count of Article Views (full-text article views including HTML views, PDF and ePub downloads, according to the available data) and Abstracts Views on Vision4Press platform.
Data correspond to usage on the plateform after 2015. The current usage metrics is available 48-96 hours after online publication and is updated daily on week days.
Initial download of the metrics may take a while.