Fig. 7
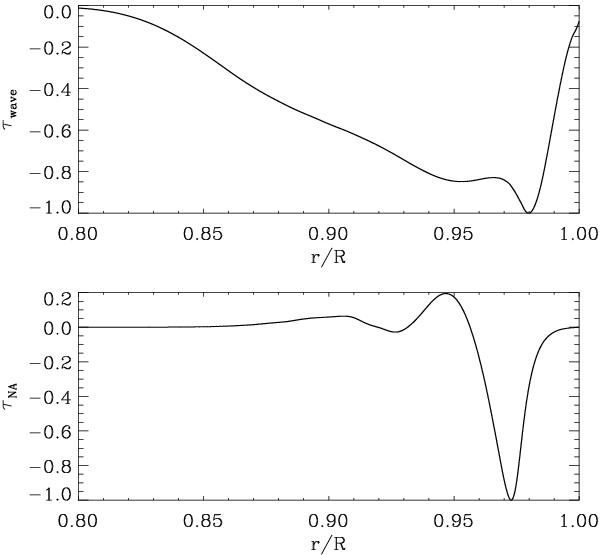
Contribution of the different layers to the change in the splitting of the l = 1, ν = 2807.5 μHz mode due to the ℓ = 4, m = 4, ν = 436 μHz g-mode according to Eq. (10). Top panel is for τwave and bottom panel for τNA. Values were normalized to the maximum. Note that only the upper layers of the model are shown because the contribution of deeper layers is negligible. Model 1 was used.
Current usage metrics show cumulative count of Article Views (full-text article views including HTML views, PDF and ePub downloads, according to the available data) and Abstracts Views on Vision4Press platform.
Data correspond to usage on the plateform after 2015. The current usage metrics is available 48-96 hours after online publication and is updated daily on week days.
Initial download of the metrics may take a while.