Fig. 3
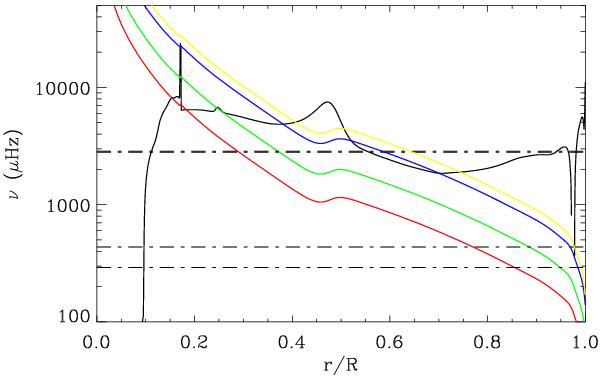
The black solid line is the Brunt-Väisälä frequency, N, while the red, green, blue, and yellow lines are the Lamb acoustic frequencies, Sℓ, for ℓ = 1, 2, 4, and 5, respectively. The dashed horizontal lines correspond to the modes indicated in the text (the ℓ = 1 and ℓ = 2 p-modes look like a single thick line). Model 1 was used.
Current usage metrics show cumulative count of Article Views (full-text article views including HTML views, PDF and ePub downloads, according to the available data) and Abstracts Views on Vision4Press platform.
Data correspond to usage on the plateform after 2015. The current usage metrics is available 48-96 hours after online publication and is updated daily on week days.
Initial download of the metrics may take a while.