Fig. 3
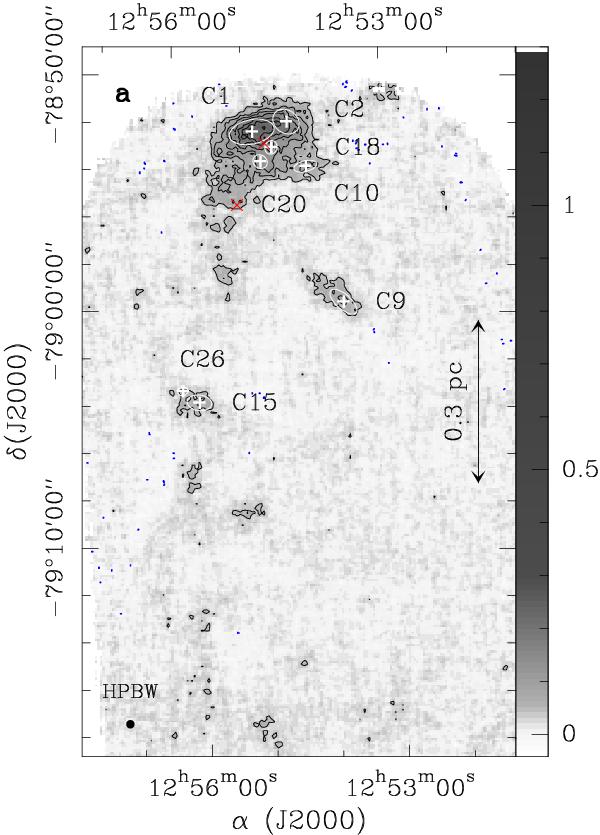
Detailed 870 μm continuum emission maps of Cha III extracted from the map shown in Fig. 2. The flux density grayscale is shown to the right of each panel and labeled in Jy/21.2″-beam. It has been optimized to reveal the faint emission with a better contrast. The contours start at a and increase with a step of a, with a = 34.5 mJy/21.2″-beam, i.e., three times the rms noise level. The dotted blue contour corresponds to − a. The angular resolution of the map is shown in the lower left corner of each panel (HPBW = 21.2″). The white plus symbols and ellipses show the positions, sizes (FWHM), and orientations of the Gaussian sources extracted with Gaussclumps in the filtered map shown in Fig. 4a. The sources are labeled like in the first column of Table 3. The (red) crosses show the peak position of the 38 clumps detected in C18O 1–0 with SEST (Gahm et al. 2002). a) Field Cha3-North.
Current usage metrics show cumulative count of Article Views (full-text article views including HTML views, PDF and ePub downloads, according to the available data) and Abstracts Views on Vision4Press platform.
Data correspond to usage on the plateform after 2015. The current usage metrics is available 48-96 hours after online publication and is updated daily on week days.
Initial download of the metrics may take a while.