Fig. 8
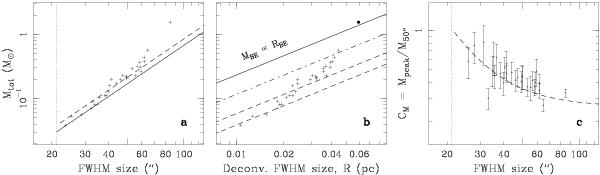
a) Total mass versus mean FWHM size for the 29 starless sources found with Gaussclumps in the sum map of Cha III at scale 5. The angular resolution (21.2″) is marked by the dotted line. The solid line (M ∝ FWHM2) is the 5σ peak sensitivity limit for Gaussian sources. The dashed line shows the 6.3σ peak sensitivity limit which corresponds to a completeness limit of 90% for Gaussian sources. b) Total mass versus mean deconvolved FWHM size. Sizes smaller than 25.4″ were set to 25.4″ before deconvolution (see note b of Table 3). The solid line shows the relation  that characterizes critical Bonnor-Ebert spheres (see Sect. 4.3.6). The dash-dotted line shows the location of this relation when divided by 2, and the dashed lines when divided by 4 and 6. The source with a mass larger than the critical Bonnor-Ebert mass MBE,Pext estimated from the ambient cloud pressure is shown with a filled circle. c) Mass concentration versus mean FWHM size. The dashed line is the expectation for a circular Gaussian flux density distribution.
Current usage metrics show cumulative count of Article Views (full-text article views including HTML views, PDF and ePub downloads, according to the available data) and Abstracts Views on Vision4Press platform.
Data correspond to usage on the plateform after 2015. The current usage metrics is available 48-96 hours after online publication and is updated daily on week days.
Initial download of the metrics may take a while.