Fig. 9
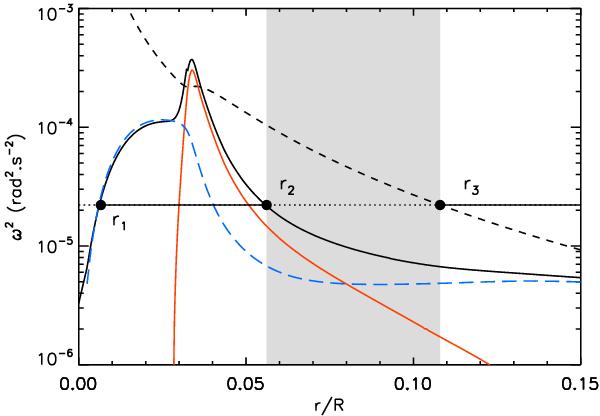
Propagation diagram for a 1.3 M⊙ post-main-sequence model with an ℓ = 1 avoided crossing. The Brunt-Väisälä frequency (black solid line) can be separated in two contributions: the part linked to the temperature stratification (long-dashed blue line) and the one linked to the gradient of mean molecular weight (red solid line). The Lamb frequency for ℓ = 1 modes is represented by the black dashed line. The shaded area indicates the evanescent zone. The radii r1 and r2 correspond to the turning points of the g-mode cavity and r3 the turning point of the p-mode cavity.
Current usage metrics show cumulative count of Article Views (full-text article views including HTML views, PDF and ePub downloads, according to the available data) and Abstracts Views on Vision4Press platform.
Data correspond to usage on the plateform after 2015. The current usage metrics is available 48-96 hours after online publication and is updated daily on week days.
Initial download of the metrics may take a while.