Fig. 4
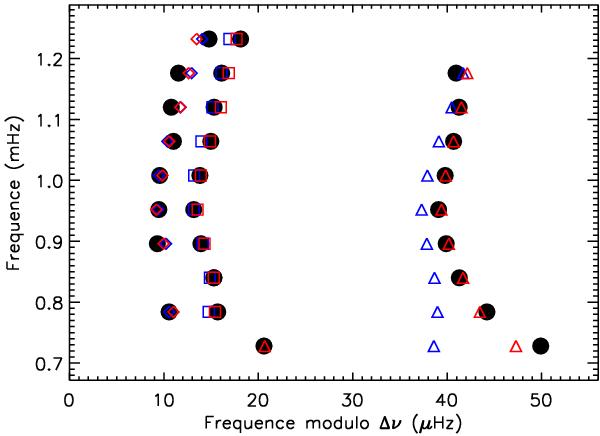
Échelle diagram of the power spectrum of HD 49385 derived from 137 days of CoRoT data, folded with a mean large separation Δν = 56.3 μHz. The frequencies of a MS model and a PoMS model are overplotted in blue and red, respectively. The models have been computed to reproduce the observed ℓ = 0 large separation as well as the position of the star in the HR diagram and the PoMS has an ℓ = 1 avoided crossing at low frequency. Squares represent ℓ = 0 modes, triangles ℓ = 1 modes and diamonds ℓ = 2 modes.
Current usage metrics show cumulative count of Article Views (full-text article views including HTML views, PDF and ePub downloads, according to the available data) and Abstracts Views on Vision4Press platform.
Data correspond to usage on the plateform after 2015. The current usage metrics is available 48-96 hours after online publication and is updated daily on week days.
Initial download of the metrics may take a while.