Free Access
Fig. 3
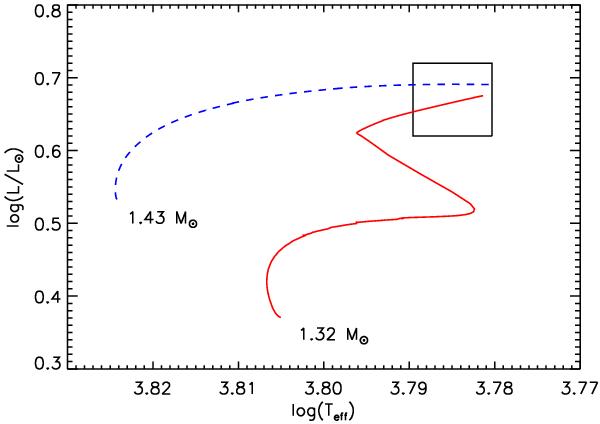
Evolutionary tracks of two models fitting the position of HD 49385 in the HR diagram. The observed values of the effective temperature and luminosity of HD 49385 are indicated within 1-σ error bars by the box. The blue dashed line corresponds to a MS model, and the red solid line to a PoMS model.
Current usage metrics show cumulative count of Article Views (full-text article views including HTML views, PDF and ePub downloads, according to the available data) and Abstracts Views on Vision4Press platform.
Data correspond to usage on the plateform after 2015. The current usage metrics is available 48-96 hours after online publication and is updated daily on week days.
Initial download of the metrics may take a while.