Fig. 18
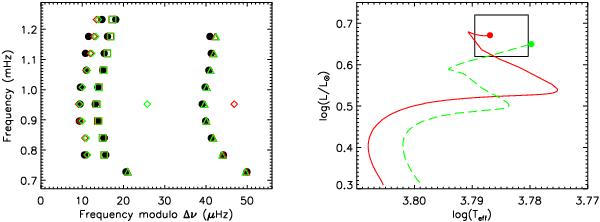
Left: échelle diagrams of the best-fit models with low overshooting (green) and with high overshooting (red). The squares represent ℓ = 0 modes, triangles ℓ = 1 modes, and diamonds ℓ = 2 modes. The observations are represented by the black filled circles. Right: evolutionary tracks in the HR diagram of the two models (green dashed line: low overshooting; red solid line: high overshooting).
Current usage metrics show cumulative count of Article Views (full-text article views including HTML views, PDF and ePub downloads, according to the available data) and Abstracts Views on Vision4Press platform.
Data correspond to usage on the plateform after 2015. The current usage metrics is available 48-96 hours after online publication and is updated daily on week days.
Initial download of the metrics may take a while.