Free Access
Fig. 15
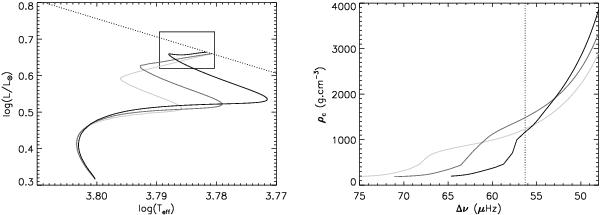
Evolutionary tracks in the HR diagram (left) and evolution of the central density ρc (right) for models with the same mass but different values of αov (αov = 0, 0.08 and 0.15 from light gray to dark gray). The observed mean value of the large separation is represented by the dotted line.
This figure is made of several images, please see below:
Current usage metrics show cumulative count of Article Views (full-text article views including HTML views, PDF and ePub downloads, according to the available data) and Abstracts Views on Vision4Press platform.
Data correspond to usage on the plateform after 2015. The current usage metrics is available 48-96 hours after online publication and is updated daily on week days.
Initial download of the metrics may take a while.