Free Access
Fig. 10
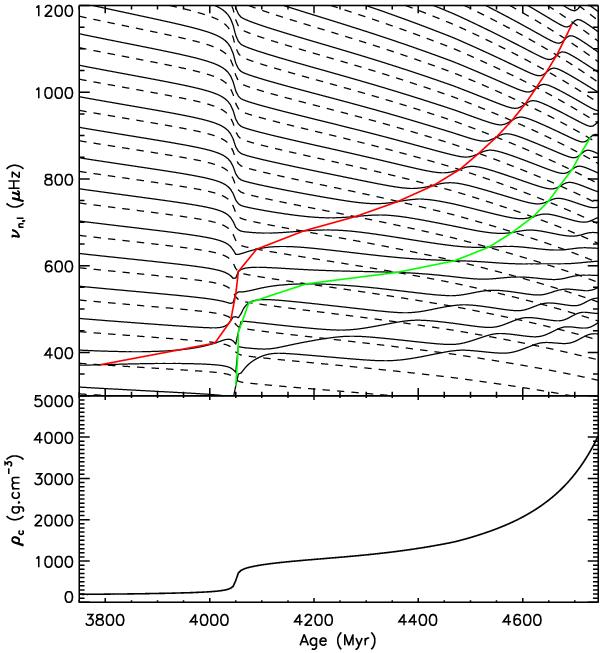
Top: evolution of the frequencies of ℓ = 0 modes (dashed black lines) and ℓ = 1 modes (full black lines) with age for a 1.3 M⊙ model. The frequencies of the first two ℓ = 1 uncoupled g modes are also represented (g1 mode in red and g2 mode in green). Bottom: evolution of the central density ρc with age for the same model.
Current usage metrics show cumulative count of Article Views (full-text article views including HTML views, PDF and ePub downloads, according to the available data) and Abstracts Views on Vision4Press platform.
Data correspond to usage on the plateform after 2015. The current usage metrics is available 48-96 hours after online publication and is updated daily on week days.
Initial download of the metrics may take a while.