Fig. 5
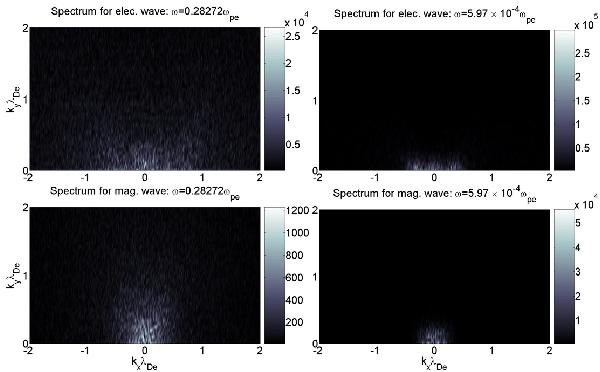
Spectrum analysis of simulation in the linear stage (left panels) and nonlinear stage (right panels). The analyzed interval for the linear stage is  and the highest intensity takes place at frequency ω ≈ 0.28ωpe. The analyzed interval for the nonlinear stage is
  and the highest intensity takes place at frequency ω ≈ 0.0006ωpe.
Current usage metrics show cumulative count of Article Views (full-text article views including HTML views, PDF and ePub downloads, according to the available data) and Abstracts Views on Vision4Press platform.
Data correspond to usage on the plateform after 2015. The current usage metrics is available 48-96 hours after online publication and is updated daily on week days.
Initial download of the metrics may take a while.