Fig. 9
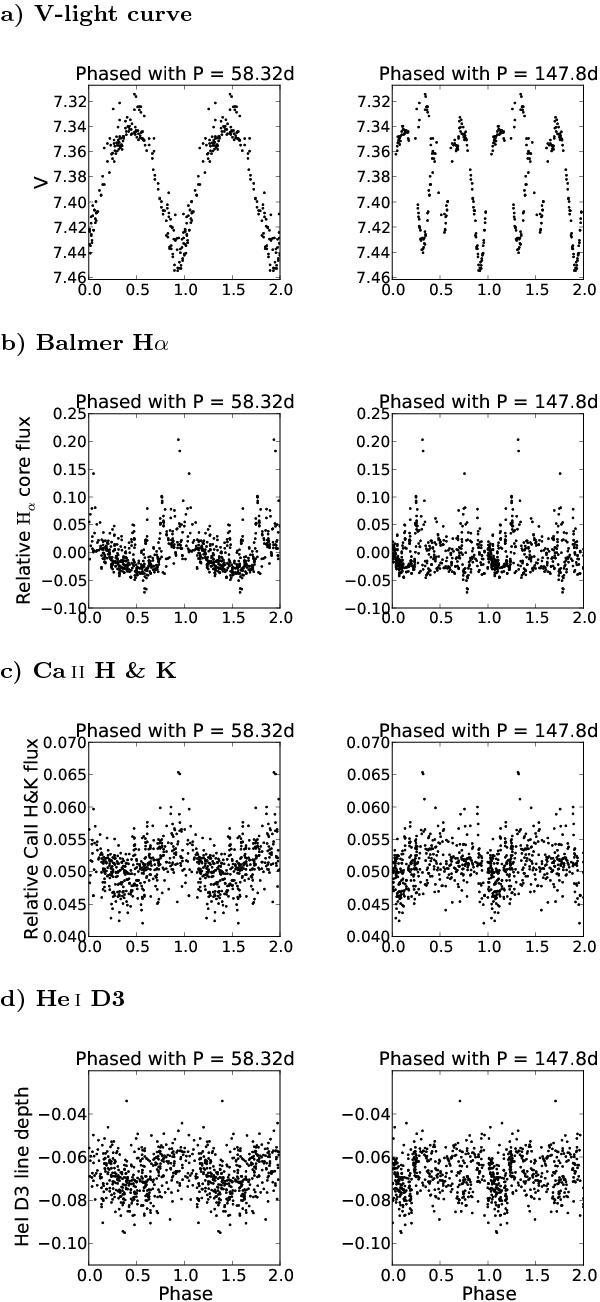
Residual variations for the observing season 2008. a) V-band light curve, b) Hα-core flux, c) relative Ca ii H&K emission-line flux, and d) He i D3 absorption line depth. The left column shows the data phased with the rotational period of 58.32 d, the right column with the orbital period of 147.89 d, both with respect to a time of periastron passage. Units are as in Fig. 8. We note the sharp decline in Ca ii H&K flux around periastron in 2008. For better visibility we plot the phases twice.
Current usage metrics show cumulative count of Article Views (full-text article views including HTML views, PDF and ePub downloads, according to the available data) and Abstracts Views on Vision4Press platform.
Data correspond to usage on the plateform after 2015. The current usage metrics is available 48-96 hours after online publication and is updated daily on week days.
Initial download of the metrics may take a while.