Fig. 7
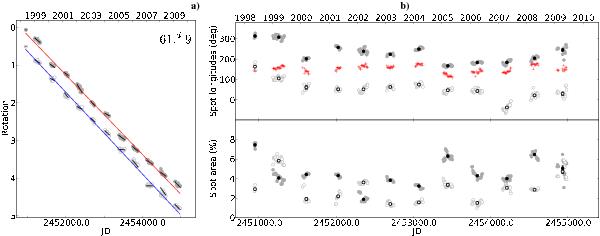
Results from the photometric spot modeling. a) The reconstructed spot longitudes expressed in stellar rotations versus time. Filled gray points refer to spot 1, open circles to spot 2. These values were obtained based on the initial photometric period of 61.9 d and after shifting full seasons by an integer rotation such that the resulting long-term migration is brought into agreement with the seasonal migration (the latter is indicated by the short lines). The two lines are linear regression fits and their slopes indicate the true rotation period of 58.32 d. b) Top panel: spot longitudes versus time based on the 58.32-d period. Filled gray points refer to spot 1, open circles to spot 2 as in panel a). The pluses indicate the longitudinal separation of the two spots and show a fairly constant value of 150° ± 17°. Bottom panel: the reconstructed fractional spot area versus time. In both panels, seasonal average values are additionally plotted.
Current usage metrics show cumulative count of Article Views (full-text article views including HTML views, PDF and ePub downloads, according to the available data) and Abstracts Views on Vision4Press platform.
Data correspond to usage on the plateform after 2015. The current usage metrics is available 48-96 hours after online publication and is updated daily on week days.
Initial download of the metrics may take a while.