Fig. 3
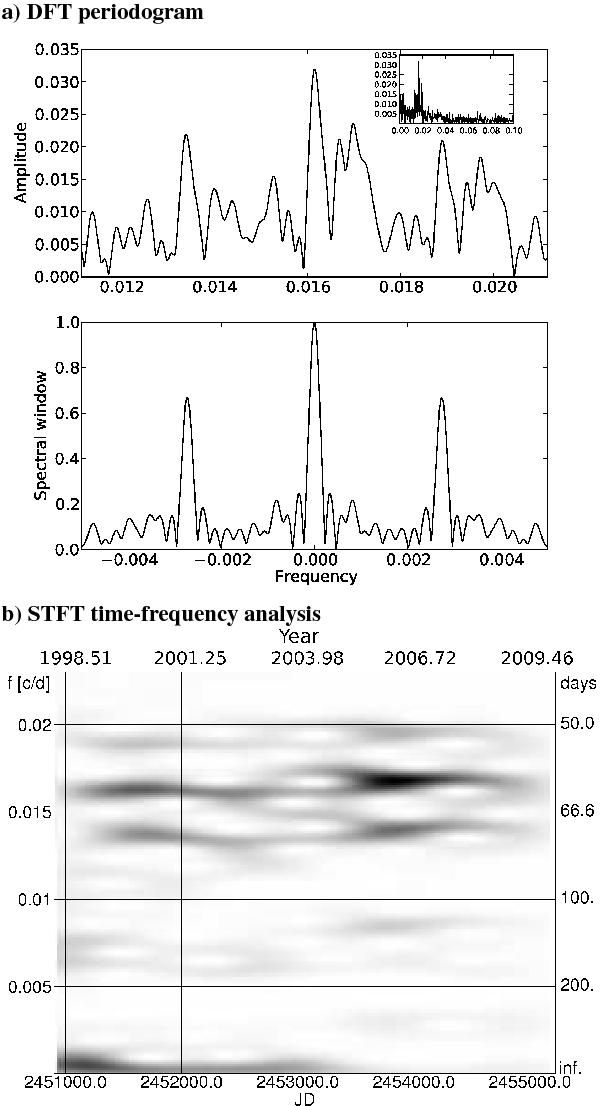
Periodograms from HD 123351 photometry. a) Discrete Fourier transform (DFT) periodogram from the pre-whitened V-band data (top panel). The twelve-year average period is 61.9 d (0.01616 c/d). The bottom panel is the corresponding window function. The insert in the top panel shows the entire search range. b) Two-dimensional short-term Fourier transform (STFT) analysis. The power distribution in the time-frequency plane is shown as a gray scale (black means highest power, white no power). It shows that the photometric period reached values between a maximum of 62.0 d and a minimum of 57.3 d. Around 2 453 000 (2002–2005), a bimodal distribution was recovered. Note that the excess power in the lower left corner is due to the length of the data vector and is artificial.
Current usage metrics show cumulative count of Article Views (full-text article views including HTML views, PDF and ePub downloads, according to the available data) and Abstracts Views on Vision4Press platform.
Data correspond to usage on the plateform after 2015. The current usage metrics is available 48-96 hours after online publication and is updated daily on week days.
Initial download of the metrics may take a while.