Fig. 11
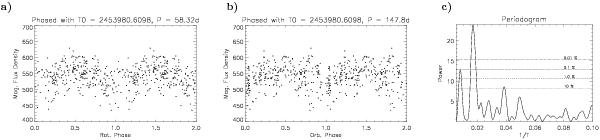
Magnetic flux variation for the observing season 2008. a) Phase plot with the stellar rotation period of 58.32 d, b) phase plot with the orbital period of 147.89 d, and c) Lomb-Scargle periodogram from the 273 individual spectral line inversions. The two strongest peaks in the periodogram agree with the rotational and the orbital periods, respectively. The strongest peak refers to a period of 58.7 d, the second strongest peak to 144.3 d. Note again that we plot the phases twice for clearer visibility.
Current usage metrics show cumulative count of Article Views (full-text article views including HTML views, PDF and ePub downloads, according to the available data) and Abstracts Views on Vision4Press platform.
Data correspond to usage on the plateform after 2015. The current usage metrics is available 48-96 hours after online publication and is updated daily on week days.
Initial download of the metrics may take a while.