Fig. 1
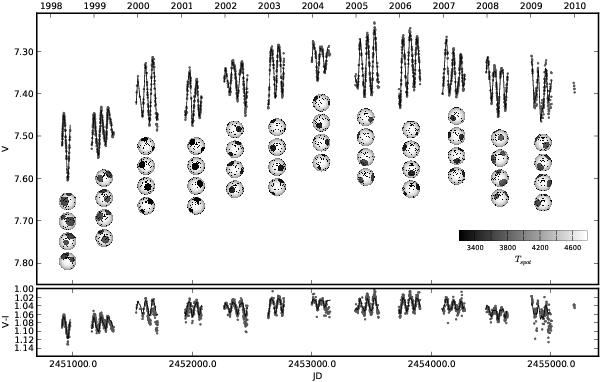
The long-term brightness variations of HD 123351. The top panel shows our twelve years of V-band photometry (dots), the lower panel plots the corresponding V − I color index. The lines are the seasonal fits of the two-spot models from Sect. 4. These models are plotted here as spherical projections at four different phases (from top to bottom, 0°, 90°, 180°, 270°). The gray scale indicates the spot temperature. Note the rotational modulation with a period of ≈ 60 d and a long-term variation in both V and V − I in the sense that the star appears redder when fainter.
Current usage metrics show cumulative count of Article Views (full-text article views including HTML views, PDF and ePub downloads, according to the available data) and Abstracts Views on Vision4Press platform.
Data correspond to usage on the plateform after 2015. The current usage metrics is available 48-96 hours after online publication and is updated daily on week days.
Initial download of the metrics may take a while.