Fig. 2
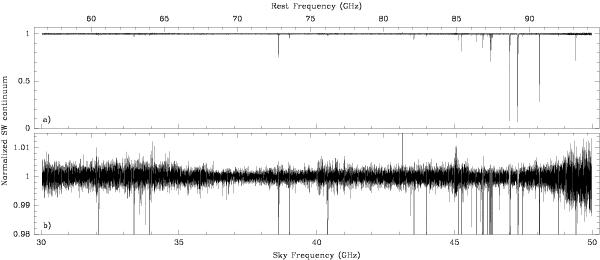
a) Full 30–50 GHz spectral band observed toward PKS 1830−211 with the ATCA, normalized to the continuum flux of the SW image of the quasar (38% of the total flux). b) Same spectral interval, but limited to a scale of a few percent of the SW continuum intensity, to illustrate the noise level over the band. The rest-frame frequency axis is given on top of the figure.
Current usage metrics show cumulative count of Article Views (full-text article views including HTML views, PDF and ePub downloads, according to the available data) and Abstracts Views on Vision4Press platform.
Data correspond to usage on the plateform after 2015. The current usage metrics is available 48-96 hours after online publication and is updated daily on week days.
Initial download of the metrics may take a while.