Free Access
Fig. 7
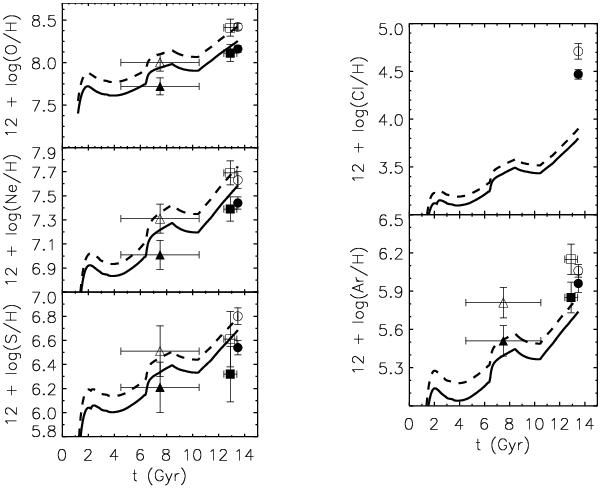
The evolution for O/H, Ne/H, S/H Cl/H and Ar/H for two models, M4Ckoba (solid line) and M1Rkoba (dashed line), based on Kobayashi et al. (2006) yields. The filled circles, filled squares, and filled triangles represent the average observational values for H ii regions, young, and old PN populations, respectively.
Current usage metrics show cumulative count of Article Views (full-text article views including HTML views, PDF and ePub downloads, according to the available data) and Abstracts Views on Vision4Press platform.
Data correspond to usage on the plateform after 2015. The current usage metrics is available 48-96 hours after online publication and is updated daily on week days.
Initial download of the metrics may take a while.