Fig. 4
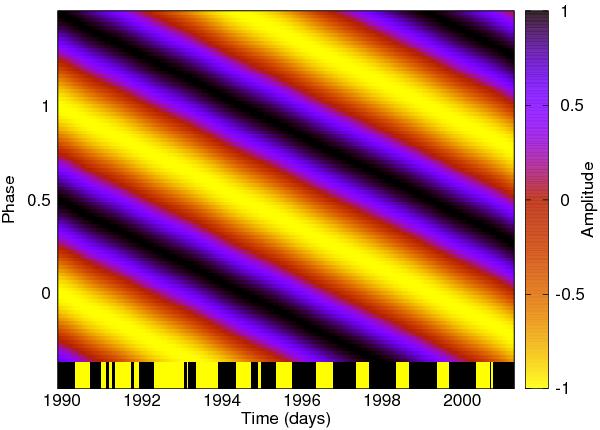
Time-dependent phase diagram, i.e. the light curve amplitude profile over phase (y-axis) plotted as function of time (x-axis), for the mismatched carrier frequency example presented in Sect. 3.2. In this plot, a slightly too low carrier frequency of ν0 = 0.148714 is used, with K = 1 model and L = 8 modulation harmonics. Time points are obtained from real V-band photometric observations of LQ Hya; the bar-code in the bottom of the plot indicates when data has been available (black) and the gaps (bright). For visualization details see Sect. 2.6.
Current usage metrics show cumulative count of Article Views (full-text article views including HTML views, PDF and ePub downloads, according to the available data) and Abstracts Views on Vision4Press platform.
Data correspond to usage on the plateform after 2015. The current usage metrics is available 48-96 hours after online publication and is updated daily on week days.
Initial download of the metrics may take a while.