Fig. 8
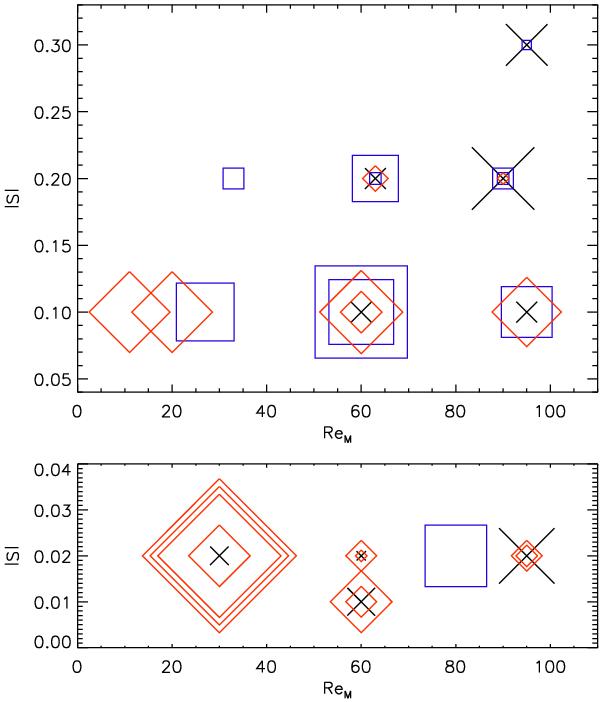
Synopsis of runs which did not exhibit the instability discussed in Sect. 5. Crosses/black: a significant α2Ω mode was never developed (cf. Fig. 4), symbol size indicates the corresponding number of runs (1, 2 or 3). Square/blue: a transition occurred, size represents the time until transition (4 to 25tres). Diamond/red: the α2Ω stage was entered, but no transition occurred. Size represents the time span of simulation (5 to 35tres). Runs at the same position differ only in random seeds. Upper panel: high-shear runs, see Table 3 for those exhibiting a random transition. Lower panel: low-shear runs. Symbols scaled down by a factor of 3 with respect to upper panel. All runs in the lower panel had f0 = 0.04.
Current usage metrics show cumulative count of Article Views (full-text article views including HTML views, PDF and ePub downloads, according to the available data) and Abstracts Views on Vision4Press platform.
Data correspond to usage on the plateform after 2015. The current usage metrics is available 48-96 hours after online publication and is updated daily on week days.
Initial download of the metrics may take a while.