Fig. 4
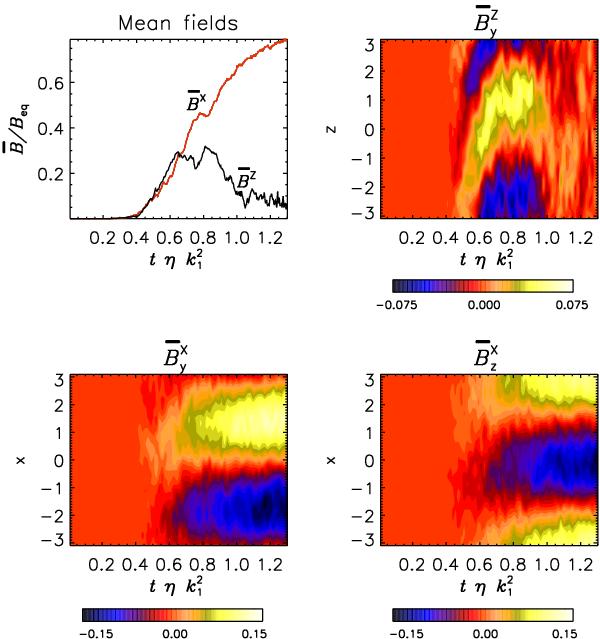
Time series for a run with same parameters as Run J of Table 2, but different initial conditions, showing a transient, rather
than a quasi-stationary α2Ω regime. Top
left: rms values of  and
and
 to
be associated with the α2Ω (black) and the
α2 mode (red). Note the lack of a well defined phase
with a dominating, but declining α2Ω mode. Top
right: butterfly diagram of
to
be associated with the α2Ω (black) and the
α2 mode (red). Note the lack of a well defined phase
with a dominating, but declining α2Ω mode. Top
right: butterfly diagram of  ,
showing the traveling dynamo wave during the kinematic phase only, but later merely
fluctuations. Bottom: components of
.
,
showing the traveling dynamo wave during the kinematic phase only, but later merely
fluctuations. Bottom: components of
.
Current usage metrics show cumulative count of Article Views (full-text article views including HTML views, PDF and ePub downloads, according to the available data) and Abstracts Views on Vision4Press platform.
Data correspond to usage on the plateform after 2015. The current usage metrics is available 48-96 hours after online publication and is updated daily on week days.
Initial download of the metrics may take a while.