Fig. 1
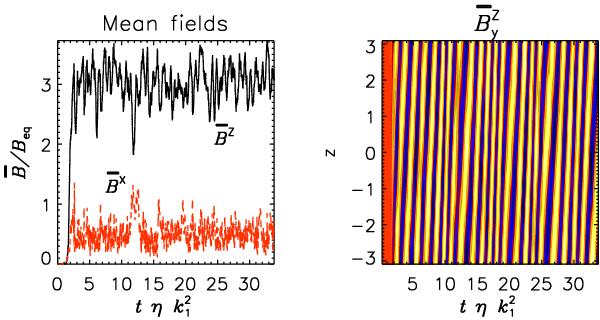
Time series for a dominantly α2Ω dynamo with
ReM = 20, PrM = 5,
S = 0.1 and kf ≈ 3.1 (corresponding
to Run H of Table 3). Left:
rms value of
 defined as
 ,
to be associated with the α2Ω mode (black/solid), and of
,
to be associated with the α2Ω mode (black/solid), and of
 ,
defined as
,
defined as
 ,
to be associated with the α2 mode (red/dashed).
Right: butterfly diagram of
,
to be associated with the α2 mode (red/dashed).
Right: butterfly diagram of
 showing the dynamo wave of the α2Ω mode; yellow (blue):
positive (negative) values.
showing the dynamo wave of the α2Ω mode; yellow (blue):
positive (negative) values.
Current usage metrics show cumulative count of Article Views (full-text article views including HTML views, PDF and ePub downloads, according to the available data) and Abstracts Views on Vision4Press platform.
Data correspond to usage on the plateform after 2015. The current usage metrics is available 48-96 hours after online publication and is updated daily on week days.
Initial download of the metrics may take a while.