Fig. 11
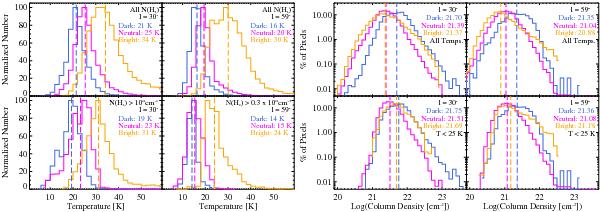
Normalized temperature and column density histograms of source pixels in the Hi-GAL fields separated by their 8 μm association; mid-IR-dark (mIRd), mid-IR-neutral (mIRn), or mid-IR-bright (mIRb). The values printed on the plots are the medians of the distributions (also seen in Table 3). The mIRd pixels tend to have the lowest temperature and highest column density, while the mIRb pixels have the highest temperature and lowest column density, and the mIRn pixels fall in the middle. Left: normalized temperature histograms in the ℓ = 30° (left) and ℓ = 59° fields (right), top panels include all source pixels while the bottom panels only include source pixels above a column density cutoff. Introducing this column density cutoff decreases the average temperature, especially for the mIRb pixels. Right: normalized percentage logarithmic column density histograms in the ℓ = 30° (left) and ℓ = 59° fields (right), top panels include all source pixels while the bottom panels only include source pixels with a temperature below 25 K. These low temperature pixels have higher column densities on average, especially the mIRb ones.
Current usage metrics show cumulative count of Article Views (full-text article views including HTML views, PDF and ePub downloads, according to the available data) and Abstracts Views on Vision4Press platform.
Data correspond to usage on the plateform after 2015. The current usage metrics is available 48-96 hours after online publication and is updated daily on week days.
Initial download of the metrics may take a while.